


This is a syndicated Science Borealis blog

-
Recent Posts
- Uranium in Nova Scotia. Powerpoint presentation
- Debunking – again – the Mining Association of Nova Scotia
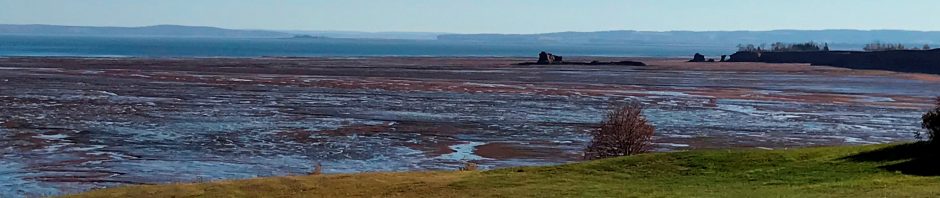
- Minas Basin in a time of climate change and sea level rise
- Debunking NS Politicians and MANS about Nova Scotia Uranium
- Commercial Special Interest Groups are bullying concerned Nova Scotia citizens
Archives
Categories
Meta
Blogs I Follow
- Critical Angle
- Petragogy
- health • budget • planet
- Shaw Sedimentology and Stratigraphy Laboratory at the University of Arkansas
- Paige Madison
- veerleintexas
- 210 Main Solar
- wileyearthpages.wordpress.com/
- Deep Climate
- Ancient Shore
- Watershed Moments: Thoughts from the Hydrosphere
- AgileGeo Science
- The Geological Society Blog
- scienceborealis.ca
Elisabeth Kosters
Tweets by EC_Kosters
Uranium in Nova Scotia. Powerpoint presentation
Posted in critical minerals, Energy, General geoscience, mining, Nova Scotia, Uranium
Leave a comment
Debunking – again – the Mining Association of Nova Scotia
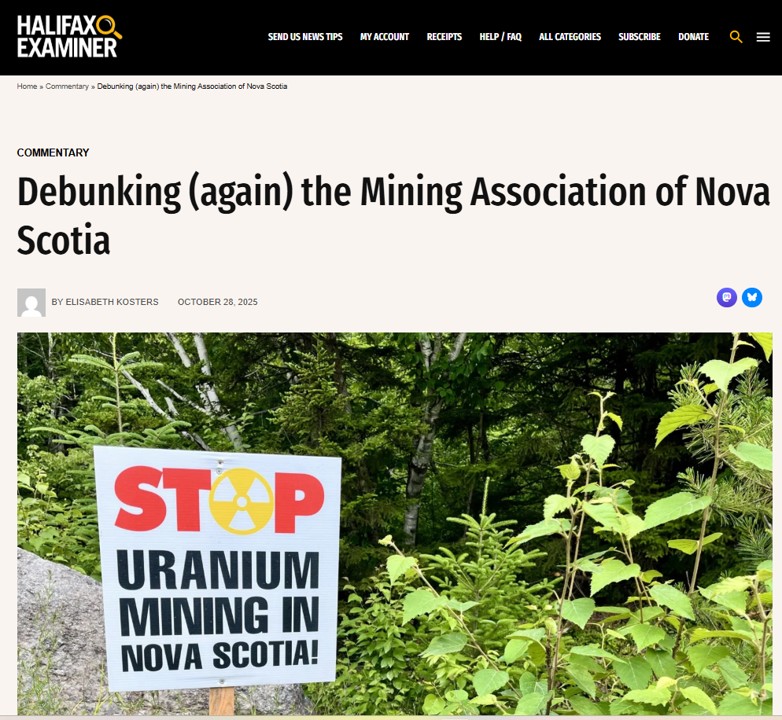
This piece was published in the Halifax Examiner on October 28, 2025.
On October 13, the Canadian Mining Journal posted an article entitled “Debate grows over Nova Scotia’s Uranium mining future”. I submitted a comment on the article’s website debunking the article’s many inaccuracies, but my comment was removed by the journal’s editor, mr Joseph Quesnel, because he thought it might be libelous. This article is essentially the same as the censored one.
While the Canadian Mining Journal article is theoretically not by mr Kirby, the executive director of the Mining Association of Nova Scotia, but by ‘Canadian Mining Journal Staff’, it only quotes mr. Kirby, who, in case readers wonder, is not a (licensed) mining engineer or a geologist. Given that the Association of Professional Geoscientists of Nova Scotia (APGNS) harassed and threatened a degree-holding Nova Scotia geologist for speaking about the geology of Uranium, it’s astonishing that the same organization never utters a word about the many errors and half-lies by the unqualified mr Kirby. So I’ll do it here.
Mr Kirby: “Experts like the Canadian Nuclear Safety Commission say Uranium mining is safe for people and the environment, and decades of experience in Saskatchewan prove it”. Mr. Kirby ignores to mention that Uranium mining in Saskatchewan takes place in an area that is uninhabited except for the tiny Indigenous community of Wollaston Lake (pop 1,200) which is about 60km from the nearest open pit Uranium mine. In contrast, Nova Scotia is the second most densely populated Canadian Province: at least half a million people live within spitting distance from the three potential Uranium exploration sites (see for example this recent article in the Halifax Examiner. These rural communities, including two First Nations communities rely on well-water (Uranium is mobile in the subsurface, especially if it’s moist) and have thriving businesses that would be forced to close in case of a nearby open pit Uranium mine. And let’s not forget that the area is also popular cottage country: Nova Scotia’s tourism income in any year is typically ten times as high as that from the mining sector.
Next quote by mr Kirby: “Discussion about uranium needs to be based on science and facts, not myths and misconceptions”. Pardon me? The citizens who oppose lifting the ban on Uranium exploration and production do so on the basis of available scientific evidence, reported – among others – at length by the Nova Scotia Department of Natural Resources (DNR) itself. The well-known risks are: exposure to Radon and the risk of elevated levels of Uranium in ground (well)water. In 2019, the then-executive director of the Nova Scotia Department of Natural Resources Don James (now retired) stated publicly that Uranium exploration would not result in additional necessary knowledge regarding these known health risks. The Canadian Association of Physicians for the Environment, not an organization that issues statements based on ‘myths or misconceptions’ has repeatedly issued dire warnings about Uranium mining anywhere near populated areas.
And then mr Kirby says “Experts like the Canadian Nuclear Safety Commission say uranium mining is safe for people and the environment, and decades of experience in Saskatchewan prove it. There is clearly no health, safety or environmental reason to ban uranium.” Can mr Kirby point us to the location of this quote? Because I can’t find it on the CNSC’s website. The only Uranium mines in Canada still in operation are the ones far away from human habitation. Madawaska, Agnew Lake and Elliott Lake, all in southern Ontario, are closed and there are massive and well-documented public health issues resulting from Uranium contamination in those areas. And please don’t tell me that these mines operated decades ago, but we now know how to mine safely. Because open pit Uranium mining (which is what happened in those areas and what would be the process in southern Nova Scotia) always creates radioactive dust, which is a huge public health risk.
Mr Kirby continued: “If Uranium actually caused the problems that some allege, the people of Saskatchewan would tell us so. Instead, 83% of people in Saskatchewan support Uranium mining, according to polling”. This is only partly true: in 2023, when Saskatchewan released its critical mineral strategy, the Federation of Sovereign Indigenous Nations, which represents 73 nations in the province, said that without consultation and built-in benefits sharing, the strategy infringes on Treaty Rights. In other words, the strategy is a yet another example of environmental racism.
Mr Kirby continues: “Uranium mining has bipartisan support in Saskatchewan. Both of the province’s main political parties, the Saskatchewan Party and the NDP, support uranium”. Again: Uranium mining in SK takes place in an almost completely uninhabited part of the Province, the workers are flown in and out on two-week shifts, there is only one community in that part of the world. I bet that if someone suddenly discovered an economic Uranium deposit within 40 km of Saskatoon, the popular opinion would shift massively, and for good reasons (rest assured, no Uranium deposit exists near Saskatoon).
The journal then continues by stating that Nova Scotia made national headlines when the Houston government lifted the province’s decades-long ban on uranium exploration and mining, effective March 26, 2025. The province said the decision would open the door to new research and economic opportunities in the resource sector. Premier Tim Houston has indeed continued to say that lifting the ban would enable research, a statement that is nonsense, because excellent research was done during all the years that the ban existed, by the Provincial Department of Natural Resources itself. More research is always good and always welcome and there was no need to lift a blanket ban to initiate location-specific research.
The article then adequately covers the 7,000+ signature petition recently submitted to the NS Legislature, a petition spearheaded by Sarah Trask who lives near one of the three potential exploration sites. But what’s Sean Kirby’s reaction? “polling commissioned by MANS in 2024 showed 54% of Nova Scotians supported uranium mining, while only 22% opposed it”. The outcome of that poll is controversial because it contains leading questions. Moreover, the word ‘Uranium’ occurs nowhere in that poll so its outcome should never be cited in relation to Uranium mining.
And then MANS (mr Kirby) maintains Uranium could play a significant role in the Province’s future and that the ban on exploration and mining was not based in science. This statement is also nonsense. The Nova Scotia ban was based on thorough medical and environmental science (the latter by the Provincial DNR itself): mining Uranium in Nova Scotia, the second most densely populated Canadian Province with a thriving rural economy, would be harmful to people, to their livestock, to their crops and to communities at large. As recently as 2019, the Nova Scotia government’s Committee on Natural Resources and Economic Development, after hearing testimony from DNR officials and weighing the input from industry representatives (a.o. mr Kirby), adopted the following motion: “Given the significant public concern about the risks of uranium mining, resulting in recommendations of the 1985 inquiry to issue a moratorium on the industry and subsequent legislation by the NDP Government in 2009, the committee reaffirms its support for the ban on uranium mining”.
There is a reason why neither British Columbia or Quebec, nor the US State of Virginia have ever considered ending their ban on Uranium mining. If Canada decides to go for expansion of nuclear energy, all it would have to do is divert its Saskatchewan resource to domestic use. There is enough Uranium in Saskatchewan for at least a century (and renewable energy will have taken over most of the power supply by then).
In conclusion: the debate in Nova Scotia isn’t “growing”. The population is opposed because mining this resource makes no economic sense and would put the health and well-being of citizens too much at risk. Mr Kirby spreads misinformation.
Posted in critical minerals, Energy, mining, Nova Scotia, Uncategorized, Uranium
1 Comment
Minas Basin in a time of climate change and sea level rise
This article was published in the Halifax Examiner on August 15, 2025
The town of Wolfville is an independent town within the Municipality of Kings County. Windsor is an independent town within Hants County. Both towns are situated on the shore of spectacular Minas Basin, an estuary with tide ranges up to 16m. Both towns are close to the mouth of a tidal river that debouches into the muddy southern side of Minas Basin. Windsor is on the Avon River, Wolfville is on the Cornwallis / Jijuktu’kwek River. Both towns had a natural harbour.
But this is where similarities end.
The Avon River was dammed by a causeway at Windsor in 1971, resulting in man-made Lake Pisiquid, a permanent water body. The lake is nowhere more than 2 ft deep. The aboiteau which enables a bit of water exchange, is open for 10 minutes twice a day. Between March 2021 and June 2023, the aboiteau was permanently open on an order of the Federal Minister of Fisheries and Oceans and a semblance of the original tidal estuary came back to life. But in 2023 Nova Scotia experienced catastrophic forest fires and then-Provincial Minister of Emergency Management John Lohr decreed that a filled Lake Pisiquid was essential as a water source for the fire department, so he ordered the aboiteau back in operation through an emergency measure that the minister must sign off on every two weeks – to this date. The Federal Fisheries Ministers have decided not to intervene. Mi’kmaw protesters camped at the aboiteau for years demanding that the river be allowed to flow naturally so that fish can migrate. To date, the situation in Windsor remains in limbo.
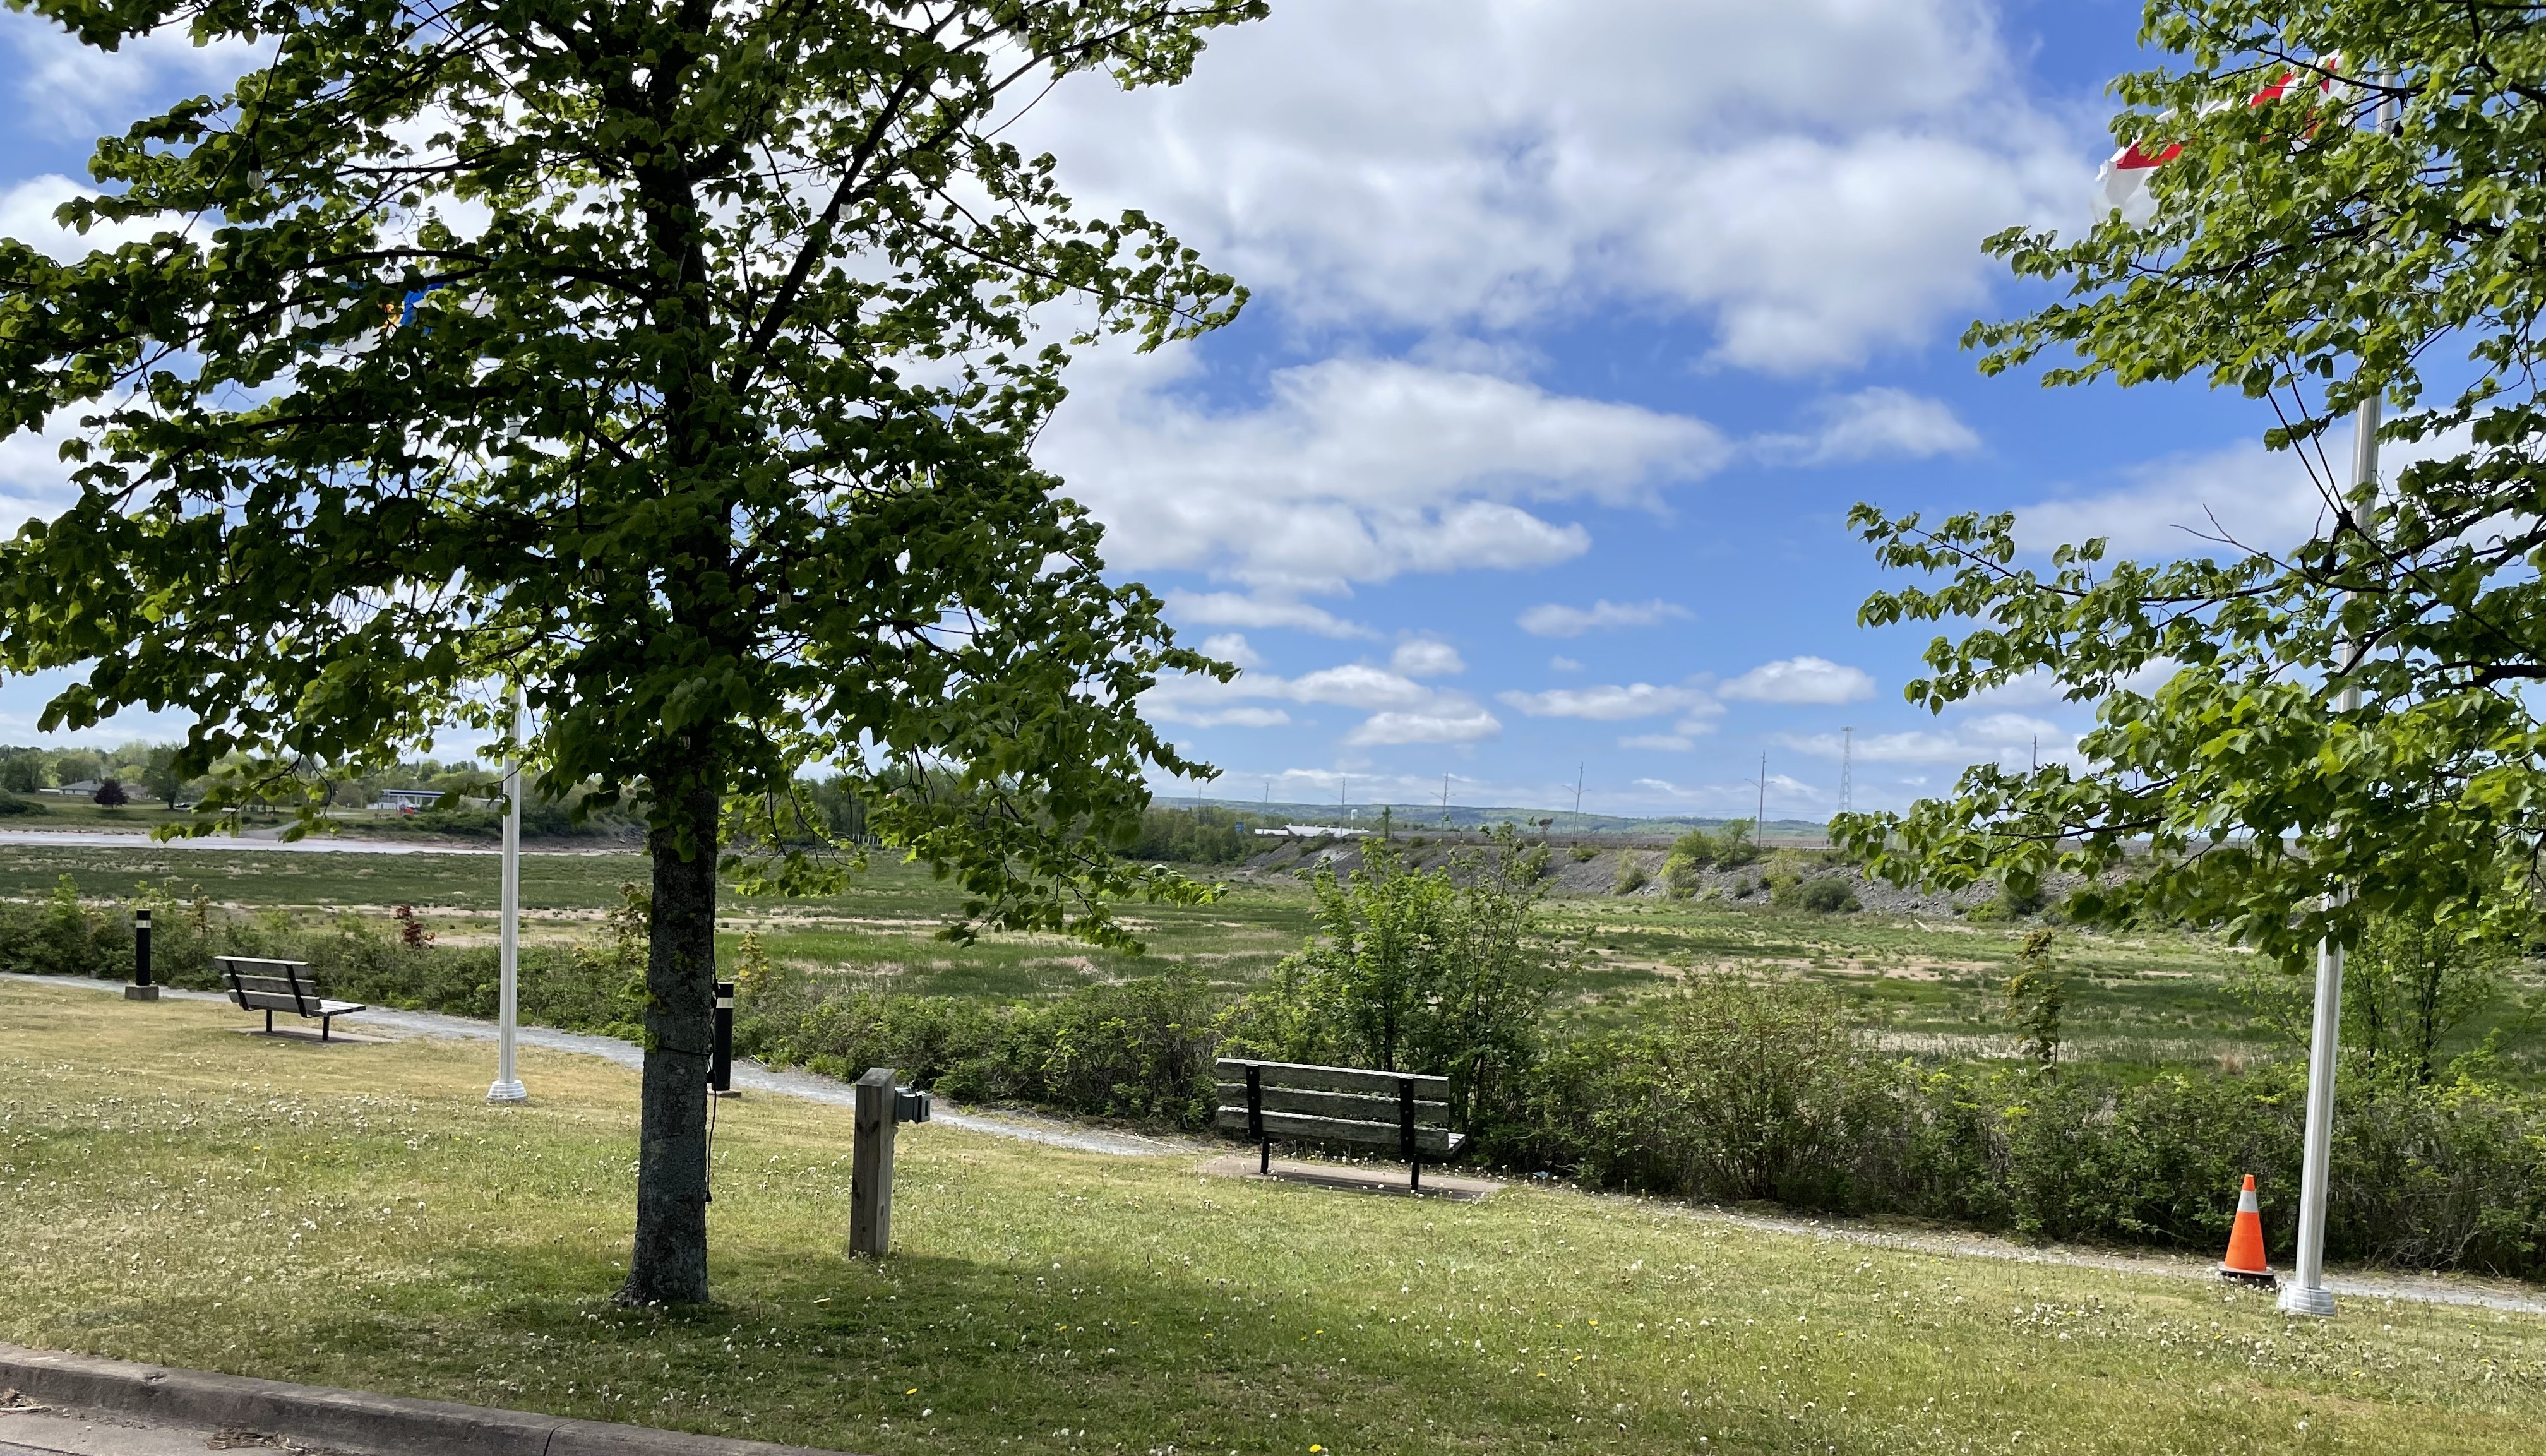
Dried-up Lake Pisiquid on May 29, 2023. The water in the back is the free flowing tidal Avon River. To the right is the dam with stalled construction of the yet-to-be twinned highway 101.
Wolfville has a minuscule harbour that berthed tall ships and steamers until World War 2. It’s not been used since. The rotting remains of the abandoned railway form the southern embankment of the harbour, a construction that’s not up to standards in terms of coastal protection.
The lame duck harbour of Wolfville is celebrated even though it’s just bare mud for all but a few hours a day. For Wolfville to be properly protected from rising sea level and storms, the most rational thing to do would be to close its 500 m harbour entrance by a dyke. Just connect the two dykes that are already there. A “Windsor solution”. Needless to say, this won’t happen. There’s way too much sentimental buy-in for that harbour. Wolfville prefers to risk flooding: high-end condominium construction continues within the downtown flood-prone core.
Sentimentality is partly why lake Pisiquid is maintained: the canoe club, the pumpkin race, the ski hill – those problems are “solved”. The Windsor fire department isn’t worried about having access to enough water, but most citizens of Windsor want their “lake”, whereas the citizens of Wolfville want their “harbour”.
Nova Scotia’s coastal areas and dykelands are managed by a bewildering number of authorities, making for the sort of patchwork decisions illustrated above. The figure below is from a 2019 article by Nova Scotia researchers Rahman, Sherren and Van Proosdij (https://www.mdpi.com/2071-1050/11/23/6735): four different Provincial departments, individual Municipalities and the intergovernmental Marsh Body, plus the Federal Department of Fisheries and Oceans all have a say about various skinny intervals in the narrow belt between municipality and the open ocean. If this figure confuses you, you’re not alone.

Because my property borders the Wolfville/Grand Pre dykeland, I get invited to stakeholder meetings about dyke reinforcement by the NS Department of Agriculture (NSDA, green in the diagram). These meetings are attended almost exclusively by dykeland farmers. The superintendent of the Grand Pre National Historic Site usually attends, as does an occasional Municipal councillor and ditto journalist. The discussion – if any – is dominated by farmers expressing concern about losing farmland and NSDA staffers explaining and reassuring them. I have never experienced an open discussion about alternative ways of managing dykeland in cooperation with municipalities: the only debate is ever about maintaining dykeland and securing access for farm equipment. DFO is occasionally mentioned as an irritant (‘they just want fish to migrate’).
I understand farmers’ concerns: they run independent businesses in an increasingly hostile climate, they are on edge, and even more so when faced with inconsistent patchwork policy and partially informed bureaucrats. At one meeting, the NSDA representative presented a dyke realignment proposal for the eastern side of the Grand Pre dykeland and then admitted he had never been there in person (he also admitted he’d grown up in New Ross………).
The surface of the current dykeland lies several meters below the high tide level. The incoming tides leave sediment on the salt marshes on the bay side of the dykes and in this manner these salt marshes maintain themselves at mean high tide level, but the dykeland receives no sediment and has dewatered and compacted as a result of two centuries of farming.
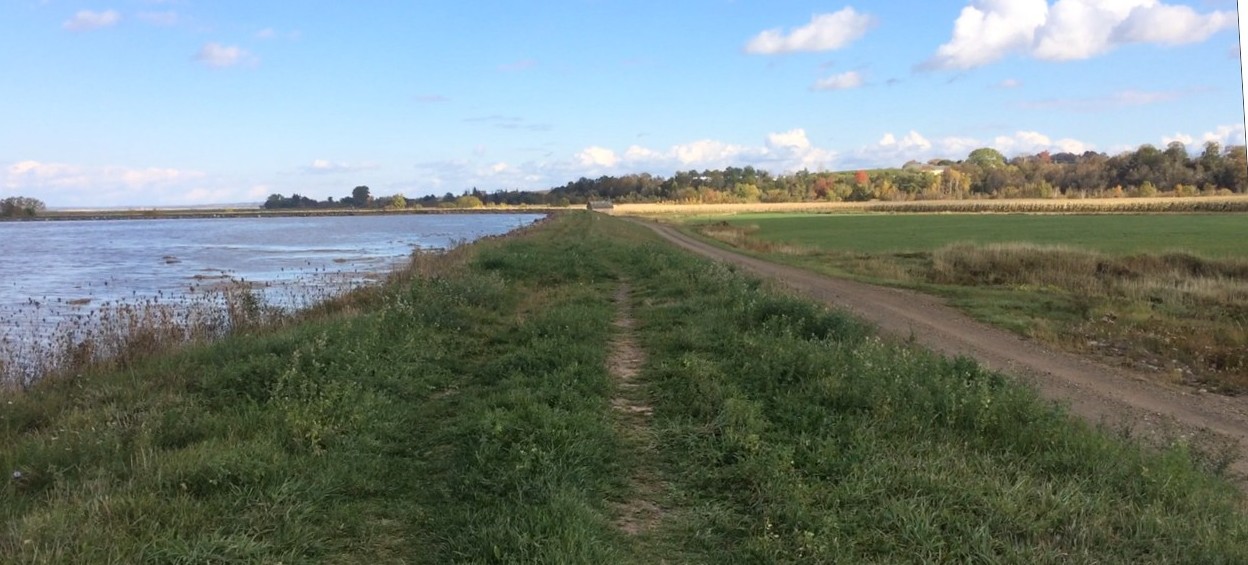
Spring tide, Wolfville dyke: the surface of the dykeland to the right is about 6 feet (1.8m) below the high tide level.
But if sea level rises 1.8 meters (6 feet) before the end of the century, saltwater intrusion in dykeland is only going to get worse, thus limiting potential crops (at present mostly grass, corn and soybeans and an occasional industrial site). The estimated sea level rise is why most dyke levels are scheduled to be increased by 6 feet in the next few years. Many readers will probably think that the Netherlands has practiced agriculture below sea level for centuries so we can surely do that too around Minas Basin? Well, it’s not the same – at all. First of all, the largest tide range along the Dutch coast is just over 4m, about 1/3 of the tidal range in Minas Basin. A lower tide range necessitates lower dykes. In addition, many of the Dutch dykelands exist next to major cities (Rotterdam, Amsterdam, The Hague, Delft) that are crucial economic drivers. No Minas Basin dykeland can make that claim. The Dutch government has changed its approach to dealing with the rising sea from ‘working against nature’ to ‘working with nature’ because the first approach, which they’ve practiced for hundreds of years, is no longer working in an age of rapidly rising sea level. This new approach applies to the entire country, not just to individual municipalities or sections of dykeland. By far the most interesting innovation under this umbrella of innovative measures is the ‘Wisselpolder’, a fabulous term that’s hard to translate. I’ll call it the ‘on-off dykeland’. The practice is shown here

Here in Minas Basin, the difference in elevation between a perigean high tide and the dykeland surface is already quite dramatic and will increase dramatically by mid century, resulting in even more salt water intrusion and a very risky elevation difference between dyke and dykeland. The NS Department of Agriculture – in keeping with the spirit of these times – calls its approach ‘Working with the Tides’, a process that may involve ‘dyke realignment’ (retreat and readjustment) along short, selected stretches. Most dykes, however, will increase massively in height.
Should we really be spending millions of dollars to add 6 feet to dykes that protect small bits of farmland that already struggle with saltwater intrusion, a struggle that will only get worse with higher dykes? Do we really think that an elevation difference of 12 m between high tide and dykeland surface is sustainable? Should we really continue to have seven different authorities work in isolation of each other? Or should we try to come up with comprehensive strategies for the entire basin (such as through a Coastal Protection Act maybe?) to survive this climate-change driven onslaught, working with nature rather than against it everywhere (not just in postage stamp size areas), allowing dykelands to improve with natural sediment (while compensating farmers), and thus create healthier and more robust buffers between the sea and our towns?
Debunking NS Politicians and MANS about Nova Scotia Uranium
My article debunking Nova Scotia politicians and special interest group MANS appeared in the regional Nova Scotia Paper on July 25, 2025. Full text:
Letter to the Editor of the Valley Journal Advertiser
Dr Elisabeth Kosters – geologist.
The July 18 issue of the Valley Journal Advertiser contains an article by Carol Morris-Underhill entitled ‘Letters flood in opposing uranium exploration’.
The article reports on the letter that the Acadia University Faculty Council on the Environment and Sustainability Studies (ESST) sent to protest Premier Houston’s hasty re-opening of the Province to Uranium exploration. It also reports on the letter sent by the Canadian Association of Physicians for the Environment (CAPE) to the Premier, explaining why Uranium exploration (let alone production) remains a massive risk to human health. And it reports on similar statements by the Assembly of Nova Scotia Mi’kmaw Chiefs, the Ecology Action Centre, the West Hants Regional Municipality, and local citizens Sarah Trask and Chad Pothier.
The article then goes on to quote Municipal Affairs minister John Lohr and the Mining Association of Nova Scotia. These quotes paint a deceiving picture to a not-too-well informed public. I’m dismayed that the author did not quote several articles published in the Halifax Examiner by journalist Joan Baxter and myself. These articles take the nonsense out of the statements of the minister and MANS. See www.earthsciencesociety.com for free access.
- Minister John Lohr promised – in March – that ‘there would be safeguards in place before any mining could occur – while stressing the importance of extracting critical minerals needed to power renewable low-emission energy systems’ (he means low Carbon emissions). ‘Additionally, uranium plays a key role in nuclear energy, providing a stable, low-carbon power source to complement renewables and reduce reliance on fossil fuels’. These are veiled untruths: first of all, a ‘critical mineral’ is a moving target. These days, ‘critical minerals’ are defined as earth resources that are critical for society to transition from predominantly using Carbon-based energy sources to non-carbon energy sources. The Canadian list of critical minerals is produced by the Geological Survey of Canada and can be examined here. Uranium does indeed appear on that list. But what the list doesn’t tell you, is that it takes at least a decade to build a nuclear power plant and that building a nuclear power plant costs a vast amount of conventional Carbon-based energy and that during the time that the plant is under construction, society could be using those resources to build renewable energy sources. And whereas Uranium is what runs a nuclear power plant, Canada doesn’t have a shortage of it – at all. Almost the world’s largest Uranium deposit is present in northern Saskatchewan, in an area the size of Nova Scotia, with a permanent population of 3,000 people in the Indigenous town of Wollaston Lake. The workers of the half dozen Uranium mines in the area are flown in and out. 80% of Saskatchewan Uranium is exported abroad. If we decide we want more nuclear energy in Canada, we just keep the Saskatchewan reserve for ourselves. There is zero need to expose densely populated Nova Scotia to the risk of Uranium mining, even if that practice has become safer than it was in decades past.
- Minister Lohr also states ‘Uranium exists in Nova Scotia but because of restrictions since the 1980s, we have been prevented from even researching it. We don’t know exactly where it is, how much there is, or what it means for Nova Scotians’. This is nonsense. Research was always possible. I myself was a co-advisor on an Acadia University MSc thesis on Uranium in 2011. The student (and I went with her, as did her main supervisor) did field work and examined the cores taken in the Three Mile Plains area in the early ‘90s (the cores are stored at the Department of Natural Resources’ core facility). The ban did not prevent research. If Nova Scotia leadership had decided that it was time to do more research (definitely a good idea), it would have simply tasked DNR with working out a research plan and budget.
- Then the article quotes the Mining Association of Nova Scotia (MANS) and states that this organization is in favour of lifting the moratorium on uranium exploration and mining (they are a mining industry lobby group, of course they are in favour – does a fish vote for clean water?). MANS is anything but an objective authority, they have too much self interest! The article also quotes MANS stating “some people say we should leave uranium in the ground because they think – incorrectly – it is safer there; the truth is uranium naturally causes health and safety risks, such as radon gas and elevated uranium levels in our water supply. Nova Scotia’s Uranium ban prevented us learning more about our Uranium deposits and to improve public safety”. This is a lie, a plain and blatant lie. The Department of Natural Resources has continued to do excellent research into the risk of Radon and Uranium in groundwater in the past decades. The results are accessible online. Anyone can get a radon test kit and a uranium groundwater test kit at most local libraries. Especially this research is exemplary and exactly what a department like DNR should be doing.
I’m disappointed that this article did not get the critical review it should have gotten before getting published. I suspect that quoting Minister Lohr and MANS counts as journalistically required ‘balance’. I’d love to see a well-researched balanced article about this issue, but this wasn’t it.
Posted in critical minerals, Energy, General geoscience, mining, Nova Scotia, Uranium
Tagged energy, environment, news, nuclear, nuclear-power
Leave a comment
Commercial Special Interest Groups are bullying concerned Nova Scotia citizens
The deadline for bidding on Uranium exploration leases in Nova Scotia came and went without the government receiving a bid. But citizens haven’t stopped worrying about the government’s actions, which is understandable given the abrupt and undemocratic way in which the process unfolded.
These two articles recently published in the Halifax Examiner demonstrate how special interest groups from industry are bullying concerned Nova Scotians. The first article is by Halifax Examiner journalist Joan Baxter, the second one by yours truly. I include the link here
Posted in critical minerals, Energy, General geoscience, mining, Nova Scotia, Uranium
Leave a comment
Statement on Uranium mining in Nova Scotia to Wolfville Town Council
I submitted this statement in person to Wolfville Town Council today, June 17, 2025.
—-
Statement on Uranium exploration to Wolfville Town Council, June 17, 2025
My name is Dr Elisabeth Kosters, I’m a retired geologist, I live in Wolfville. I urge Wolfville Town Council to issue a letter to the Nova Scotia Provincial Government / premier Tim Houston, to at least pause opening Nova Scotia to Uranium exploration and mining and preferably to reinstate the ban that was legislated in 2009. Your statement should be comparable to the letters sent by the Assembly of Nova Scotia Mi’qmaw Chiefs, the Municipalities of Pictou County, West Hants, The district of Lunenburg and Annapolis County.
Nova Scotia has Uranium. It occurs naturally in the shallow subsurface around the granite bodies that exist in our Province. Uranium is a radioactive element and decays to Lead over a few billion years. Somewhere in that isotopic chain sits unstable Radon222, a gas. Uranium may exist in your well water and Radon222 may collect in poorly ventilated basements. Long time exposure to both of these materials is a recognized significant public health risk. The Nova Scotia Department of Natural Resources has issued a publicly accessible Radon Risk map and anyone can obtain Radon test kits for free at a public library. The public health risks of exposure to naturally occurring Uranium and Radon222 can and must continue to be mitigated. As recently as 2019, the executive director of the Nova Scotia Department of Natural Resources Don James (now retired) stated publicly that Uranium exploration would not result in additional necessary knowledge regarding these known health risks and that exploring for Uranium itself had no additional benefits for Nova Scotia.
Does Nova Scotia have a large Uranium reserve? We don’t really know, because Nova Scotia has had a ban on Uranium exploration for decades. But we do know enough about it to be sure that our reserve is completely insignificant compared to that of Saskatchewan, which has about 10% of the world’s Uranium reserves, the world’s second largest reserve outside Kazakhstan. Saskatchewan’s Uranium is also of the highest possible quality. Why does this matter? Because no other Uranium reserve in Canada would ever be remotely competitive with that of Saskatchewan. In addition, the Saskatchewan reserve is located in the far northern part of the Province, in an area the size of the Nova Scotia southern mainland with a population of less than 2,000 people, all in the First Nation Community of Hatchett Lake/Wollaston Lake. These people can’t hunt or fish there because the wildlife contains too much radioactive material as a result of the mining. Saskatchewan exports 80% of its Uranium abroad. If the Federal Government decided to develop more nuclear power in an effort to combat global warming, the Saskatchewan reserve would be large enough to fulfill the necessary demand.
The Houston government has trespassed all accepted democratic processes in unilaterally opening up the Province to Uranium exploration. This is a dictatorial move by a government that got 27% of the popular vote in the most recent election. The Premier complained that public interest groups who try to protect our natural environment are ‘foreign funded activists’ but he continues to quote the Mining Association of Nova Scotia, which is a industry lobby group that is 95% foreign funded.
I rest my case and hope you will act responsibly and in the interest of all citizens.
Posted in critical minerals, Energy, General geoscience, mining, Nova Scotia, Uranium
Tagged Canada, earth science, energy, environment, geology, geoscience, minerals, nuclear, Science
2 Comments
Energy East – again?
Premier Houston demands an oil pipeline
The future is here and it’s mayhem. On March 3, 2025, US President Donald Trump announced a 30% tariff on goods imported from Canada and Mexico, 10% for Alberta oil. The threat had been hanging over our heads ever since he took office, and our political leaders prepared retaliatory tariffs (today, March 6, he announced they won’t go into effect until April, we’ll see). One consequence of this insecure global political situation is that all Canadian jurisdictions are looking closely at how secure they are in terms of food, raw materials and other essentials. And so premier Houston recently announced he’d lift the bans on Uranium mining and hydraulic fracturing (fracking) for natural gas. I disagree with lifting those bans and explained why in my previous post.
The premier has added to the mayhem by throwing out standard democratic processes to access his favourite earth resources.
Then, on February 28, Premier Houston wrote a scathing letter to Bloc Québécois Leader Yves-François Blanchet, blaming him for resisting the idea of an oil pipeline from Alberta through Québec to Atlantic Canada. Speaking to reporters in Québec in February, Mr Blanchet said: “We are fiercely opposed to any type of transport on Québec territory of hydrocarbons from Western Canada to any market whatsoever. It does not serve Québec. It does not serve the environment. It does not serve the planet”. Premier Houston wrote to Mr Blanchet “you made these comments in respect to the resurrection of an Energy East type project wherein energy would be transported from Western Canada to Eastern Canada” and then blamed Blanchet for “disparaging opportunities for energy security for all Canadians and alienating Atlantic Canada”.
First the wording. Blanchet uses the term ‘hydrocarbons’, a catch-all term for any type of oil or gas. Houston uses the term ‘energy’. Blanchet’s terminology is correct, Houston’s is not. Pipelines transport hydrocarbons, they don’t transport energy. Energy is what you get when you install equipment to burn refined hydrocarbons.
I live on a busy road and see and hear the oil trucks. They burn lots of gasoline to drive all across the Province to fill home oil tanks, an incredibly inefficient method. Only in this northeastern corner of the continent do as much as 40% of homes still heat with oil. I can’t stop being surprised that this practice still exists (full disclosure: our 72 year old house never had an oil tank). And of course Nova Scotians burn lots of gasoline in their vehicles because we have little public transport outside HRM and half our population is scattered all over the Province and electric vehicles and hybrids are expensive and hard to come by.
About 2.5 million people live in Atlantic Canada, which covers an area three quarters the size of Manitoba, and that includes all that water between our four Provinces. Compare this with for example Manitoba, which has 2 million people, half of them in Winnipeg in its far southeastern corner. Atlantic Canadians are on average a lot less accessible than Manitobans. Atlantic Canada and Quebec are insecure when it comes to fossil fuel supply. We don’t have the stuff ourselves (geology) and we’re a widely dispersed population at the edge of the continent (geography). But does that mean we need a pipeline?
Canada as an oil producer
Canada is the world’s fourth largest hydrocarbon producer; most of this reserve is in Alberta, lesser amounts are in Saskatchewan, western Manitoba and northeastern British Columbia. Oil and gas are transported by rail and by pipeline from Alberta to Vancouver (which tripled transport capacity after the completion of the Trans Mountain II pipeline this year).
Oil and gas are also transported into the US and as far east as Montreal. From Montreal, a pipeline runs to Portland (Maine) from where oil is shipped out because Maine doesn’t have refineries. This pipeline was built during World War II and parallels a pre-existing rail line, so it was relatively easy to construct in a time of crisis. The distance from Montreal to Portland is 1/3 of the distance from Montreal to Saint John or Halifax.

Most Alberta heavy crude is refined in the US. Canada has refineries, but they can’t process heavy crude, so they process light crude from the US. Don’t ask me why. When Prime Minister Stephen Harper originally proposed the Energy East pipeline as a way of transporting heavy Alberta crude to eastern Canada, the Irving Refinery in Saint John made clear that they wouldn’t be able to process it without retrofitting and expanding the refinery (and please give us the money to do so).
This was altogether aside from the fact that the existing pipeline would have to be completely retrofitted as well, to some extent rerouted and then extended, and that not only Ontario, Quebec and New Brunswick would have to agree on all aspects of that engineering process (assuming that Saskatchewan and Manitoba would agree), but also 180 First Nations through whose territories it would run. And – minor detail – it’s four times as far from Alberta to Saint John as it is from Alberta to Vancouver
Why do planned pipelines fail?
Pipelines take a long time and a lot of money to build. Investment in pipelines (government loans, grants and tax breaks, shares in the private market) is based on expected future returns.
But if you would include the long-term well-being of communities and the potential effects on biodiversity, air quality and aquatic health along a pipeline into its financial picture, the investment opportunity would begin to look different. Considering natural resources only in terms of financial assets and potential accumulation of wealth through resource extraction, ignores the importance of long-term ecological well being for people and the planet. It’s these more intangible assets that are the addressed mostly by environmental NFPs and, in Canada, by Indigenous Nations.
Let’s consider the failed Northern Gateway pipeline. Enbridge and its shareholders never lost money even though the pipeline never materialized. To garner support for the planned pipeline, Enbridge played on sentiments of future perceived wealth for communities along its route. But in the end, unresolved land claim disputes became mixed up with these imagined returns and Indigenous Nations simply couldn’t be seduced with just more money. They valued the intangible benefits of their existing way of life above the potential economic benefits of the pipeline. But years later after failing to materialize, Enbridge is alive and well and continues to trade on the stock market. Companies like this create complex financial and corporate structures that keep them afloat even when they make no money – all the while battling civil society groups that don’t have that kind of financial back-up. In other words, such a dispute is never a level playing field: one partner can rely on vast resources to push its agenda, while the other partner relies on volunteer work and free will donations.
Or consider the Trans Mountain / Kinder Morgan pipeline that eventually did get built, it runs parallel to an existing pipeline. Kinder Morgan had its headquarters in Texas and traded on the US stock exchange. Delays and conflict led to the Canadian government buying it for $4.5 billion. Trans Mountain shareholders rejoiced! Its eventual construction cost Canadian taxpayers about $16 billion and faced lots of protests (in vain) by First Nations and civil groups. The financial expense of this pipeline wasn’t just carried by a private company and its shareholders, but by all Canadians in a process that transferred private to public (you and my) debt. Trans Mountain II is an excellent example of a failed private investment project that resulted in really good returns for private investors but a decades long debt for civil society.
Private citizens buy assets and can borrow money to do so if it’s considered a good investment: homes, cars, businesses. People look after their investments so they might gain value, justifying the loan and the interest. Building a pipeline requires massive investments. The only way to justify those investments is if there is a healthy Return on Investment. In other words: if you build a pipeline, you must use it for a very long time.
Global temperatures are rising rapidly because of massive fossil fuel burning. Already the effects of man-made climate change are felt daily around the world. Averting the worst effects of global climate change means that we must change to other sources of energy as fast as possible. This is not an easy task. But investing in a fossil fuel pipeline is definitely the wrong idea, it’s a way to turn the clock back, especially when it’s unlikely the stuff going through that pipeline would benefit people of Atlantic Canada.
Conclusion
Yes, Atlantic Canadians are energy-insecure when you consider only fossil-fueled energy. But building a hydrocarbon pipeline isn’t going to solve that problem.
I agree with mr Blanchet: Energy East would not serve Québec or Atlantic Canada, it would not serve the environment and it would not serve the planet. Prove me wrong, mr Houston.
References
Government of Canada sites 1, 2, 3
Janzwood, A., Neville, K. and Martin, S., 2023, Financing energy futures: the contested assetization of pipelines in Canada, Review of International Political Economy, v. 30 no. 6, p. 2333-2356.
Posted in Energy, Nova Scotia
Tagged Climate Change, energy, environment, news, renewable-energy
Leave a comment
Critical Nova Scotia minerals in critical times?
Premier Tim Houston scared many Nova Scotians with his threats of undoing the moratoria on Uranium mining and fracking and with his under-the-table approval of a Lithium exploration license to an Australian company in SW Nova Scotia. Citizens expressed their outrage about the wide range of the premier’s dictatorial interventions. As far as these minerals, they were never mentioned as part of his very recent election platform.
There are reasons we have moratoria for the exploration and production of Uranium and fracked natural gas: these activities would lead to proven health hazards. The premier has made clear that he thinks that those who express anger and concern about his initiatives are just ‘special interest groups’. What he means is that he accuses these folks to be in the way of exploration, which he deems is a necessity because of the changed situation in the US. What he willingly ignores is that these ‘special interest groups’ (none of which he named) have the well-being of the whole population at heart, whereas his elephant-in-the-china-cabinet-approach only benefits special-interest industry sectors and not our wholesome future.
The political situation in the US is very dangerous and I do agree that such acute danger may necessitate a change in policy direction that might not have been formulated in an election platform. But is what the Premier proposes supported by science and – even in changed times – by economic necessity?
Let’s take look at each of the mentioned resources: Uranium, Lithium and Fracking for natural gas.
Uranium. Nova Scotia has Uranium. It occurs naturally in the shallow subsurface around the granite bodies that exist in the southern and northern mainland. Uranium is a radioactive (unstable) element and decays to Lead (stable) through fourteen isotopic changes over a few billion years. Somewhere in that isotopic chain sits unstable Radon222, a gas. Prolonged exposure to Radon222 is a significant health hazard. The Nova Scotia department of Natural Resources has published a Radon Risk map that every citizen can examine. It’s especially important to air your basements if you live in an area with high risk of exposure to radon gas. DNR will loan you Radon measuring equipment to assess your risk. It may also occur in your groundwater if you’re on a well. Run all your drinking water through a carbon filter to address any of these risks. As recently as 2019, DNR executive director Don James stated publicly that Uranium exploration would not result in additional necessary knowledge regarding Radon risk and that exploring for Uranium itself had no additional benefits in this regard.
Does Nova Scotia have a large Uranium reserve? We don’t really know, because Nova Scotia has had a ban on Uranium exploration for decades. But we do know that our reserve is completely insignificant compared to that of Saskatchewan, which has about 10% of the world’s Uranium reserves, the world’s second largest reserve outside Kazakhstan. Why does that matter? Because no other Uranium reserve in Canada would ever be remotely competitive with that of Saskatchewan. So promoting Nova Scotia Uranium as a significant resource is balderdash. Should we know how much Uranium we have and where it’s located? Yes – because it’s a health hazard, so we should always do that kind of research. Did the premier spout his opinion about Uranium as an economic mineral because he wants to attract research funding? If so, why didn’t he say so? If not, then his ignorance about global production and demand is embarrassing at least.
Saskatchewan happens to also have one of the world’s largest Potash reserves. Potassium, a key element of Potash, is one of three essential nutrients for agriculture (the other two are Nitrogen and Phosphorus). There are only a few very large potash deposits in the world and one of them is in Saskatchewan. A decent-sized one is in New Brunswick. About 12 years ago, the SK potash corporation bought the NB mine and promptly closed it, laying off a significant percentage of the working population in the Sussex NB area. I was in that mine once, it’s massive and impressive and I’m sure it’s now all flooded. Why did the mine close? Because the SK company didn’t want to have to deal with competition within Canada. It was more attractive to put a few hundred people out of work and thus kill the competition – so simple! Does anyone have any idea what would happen if Nova Scotia would start producing Uranium? Right? I rest my case. Nova Scotia Uranium is not now and never will be economic on any scale whatsoever and that’s leaving out whether it’s desirable to produce Uranium or not.
Lithium
Canada is estimated to have 3.6% of the world’s Lithium reserves, almost all of which are in central Canada. Nova Scotia is a tiny landmass and will never be able to contribute more than just a smidgeon of Lithium to the world’s reserves. Lithium is an essential element for rechargeable car batteries but, unlike the central Canada deposits, we are nowhere near battery plants and never will be. Should Nova Scotia ‘do its bit’ and contribute to building up the reserve of this critical mineral? Given that we have a minuscule amount no matter how much we’ll explore, that seems foolish. The areas where Lithium may occur in Nova Scotia overlap with the SW Nova Biosphere Reserve and the Annapolis valley, our one and only significant food growing area. We have one abandoned Lithium mine in SW Nova Scotia: Brazil Lake, frequently promoted by Nova Scotia geologist John Wightman (who promotes lifting the Uranium ban in the same breath, making him somewhat less credible to me). Australian (!) Manhattan Corporation was just given an exploration license for Lithium in SW Nova Scotia. Given global occurrences, this doesn’t make economic sense to me.
Fracking
Fracking is a sophisticated technical process by which natural gas can be released from so-called ‘tight’ rocks. Tight rocks are rocks with little porosity and permeability. Porosity is defined as the amount of holes in a rock. A loose sandstone has a lot of holes, it has high porosity. In order for a gas or a liquid to flow through that rock, the holes need to be connected, this is called permeability. If a rock has low porosity and permeability, it’s called ‘tight’. A tight rock that holds hydrocarbons (oil or gas) would have been ignored in the past, but fracking technology has made those hydrocarbons accessible. Here is a short video that explains the technology.
A recent letter in the Chronicle Herald by John Budreski also explains the process well. What mr Budreski didn’t tell his readers was how many holes you need to drill to access hydrocarbons in tight rocks: the well spacing may be as little as 50 meters. He also didn’t mention the problem of waste water. Fracking requires massive amounts of water, with added chemicals, and you can’t just release that waste water into any natural water body or you’d poison the environment, which is what is happening in Wyoming, a State that is still allowing fracking on a massive scale, but is now trying to regulate it.
Wastewater was the problem the first fracked well in Nova Scotia (on the Noel shore) faced: the company drilled that well before the Province had regulations in place for what to do with the waste products, then these waste products turned out to contain toxic elements, leading to a long-lasting problem of where to store it and for how long etc. Other than chemicals that the companies add to the injection water, the fracking process also releases naturally occurring chemicals from the rocks. The areas that are of interest for producing natural gas through fracking are relatively close to granite bodies and that means that the waste water has a good chance of containing radioactive Uranium and its decay elements. Oops! Aside from this, I do think it’s counterproductive to start talking about producing hydrocarbons in a time when we all agree that we need to get away from fossil fuels.
—————————
Canada is a vast country. Nova Scotia is a small peninsula far from markets, accessible only over a vulnerable isthmus that separates us – and our one industrial harbour – from the mainland. We do have the second highest population density of any province or territory, so there is a higher chance that Nova Scotians are negatively affected by resource development. If the premier intends to boost earth resource exploration in order for Canada to become less dependent on the US, then he picked the wrong ones. Who does he listen to?
Should all Canadian jurisdictions contribute to the effort to make Canada less dependent on US resources? Yes, I think we should. And I acknowledge that critical resources are to some extent moving targets: 100 years ago we still considered coal a critical resource, now not so much. Then we got a gold rush, which still lingers off and on. Then there was an offshore gas hype, which petered out quickly because our offshore is not the Gulf of Mexico after all. Now there are new resources that are needed for the new, green economy. Maybe we should have an informed public discussion, including experts from the Department of Natural Resources before we race head-over-heels into the next adventure. Maybe our premier wouldn’t then blunder again into a topic that he’s clueless about, because that’s truly embarrassing.
Posted in critical minerals, mining, Uranium
Tagged Canada, critical minerals, earth-resources, economy, Nova Scotia, Politics
1 Comment
How to go about mining in Nova Scotia?
In my previous blog post, I criticized the Mining Association of Nova Scotia (MANS) for displaying a lack of environmental, social and cultural awareness. I received many positive reactions, but not from MANS of course. Its executive director Sean Kirby responded with an all too familiar sounding broken-record statement. That weak response, displaying a lack of deeper insight, is exactly why I have a problem with MANS. But of course I shouldn’t expect anything else from what is just an industry lobbying group that wants to make a quick buck.
Climate change is an accepted existential threat to humanity. So governments are working to decarbonize energy production and consumption, a hugely complex task. While every effort that mitigates warming has a positive global effect, there are many inconsistencies. For example, worldwide demand for coal is still growing because of China and India’s demand, but does that mean we should mine more coal in Nova Scotia? Clearly – and fortunately – that’s not the plan of successive NS governments of all political colours who have worked and are working to reduce the amount of coal for electricity generation in our Province.
So what’s an important mineral in one part of the world, is off the table in another part. This doesn’t mean decarbonization is not an exact science. Hence Natural Resources Canada – together with similar expert organizations from other countries – has identified a list of critical minerals. This is great, because now we can at least separate greed (minerals we mine only for profit) from need (minerals we mine because they are critically important for building a carbon-free economy). What contribution can and should Nova Scotia make to the green transition while increasing biodiversity conservation and fully respecting Indigenous rights?
In his reply to my criticism, MANS executive director Sean Kirby listed off a list of minerals that he thinks Nova Scotia can and should supply towards the green transition: Tin, Silicate, Titanium, Gold, Metallurgical Coal, Copper, Zinc and Indium. First off, Silicate, Metallurgical Coal and Gold (!) are not on Canada’s list of critical minerals. That leaves only 5 others: Tin, Titanium, Copper, Zinc and Indium.
The Canadian Minerals and Metals plan states: “Federal, provincial and territorial governments will collaborate to better understand “criticality” in a Canadian context. They will also identify steps to strengthen domestic critical mineral supply chains, collaborate on key initiatives, and attract investment. I haven’t been able to find any sort of statement by the Nova Scotia government that lays out how our Province will contribute to this plan. The Dept of Energy and Mines (which includes the Nova Scotia Geological Survey) does excellent geoscience work and provides – equally excellent – information, but no qualified opinion. So all we have is really good government information (but no vision regarding the Canadian Minerals and Metals plan) and a lobby group (MANS) that spews self serving opinion only. This is meagre.
Mineral Resource extraction remains exclusively in the hands of private industry, which functions on the basis of profit only. Let’s face it: “growth isn’t about increasing production in order to meet human needs. It’s about increasing production in order to extract and accumulate profit” (Jason Hickel). That this rapacious principle is practiced fully by the mining industry here, can be illustrated with three examples: the Sussex (NB) Potash mine, the East Kemptville (NS) Tin-Indium mine and the Gays River (NS) Zinc mine.
Three examples: Potash, Tin and Zinc.
Potash (Potassium chloride) is an undisputed critically important mineral as Potassium is one of three essential fertilizer ingredients (the others are Nitrogen and Phosphorus). Canada has world class potash reserves, almost all of which are in Saskatchewan. But Sussex (NB) had a potash mine for many decades and I was lucky enough to visit it once: an impressive operation. In 2016, the mine was bought and promptly closed. Why? The new owners stated that the production of this critical mineral was (all of a sudden?) “too expensive”. Needless to say, that abrupt closure of this proud operation caused massive job loss, an economic punch to the gut in the area. It won’t reopen again either. This mine was closed because of a lack of profit, not because we don’t need potash. If only we had some sort of government regulation protecting our own production of critical minerals!
Tin: The International Tin Association states that there is no supply risk of Tin for at least 50 years, but the US Geological Survey is not so positive. The world’s biggest Tin reserves are in Russia, with Canada coming at 9th place. In Canada, Tin is currently only mined (as a by-product) at the Lead-Zinc-Silver-Iron Sullivan mine in BC. But then there is the abandoned South Kemptville Tin mine, within the SW Nova Biosphere reserve. Avalon Advanced Materials would like to produce Tin and Indium from its tailings, but the original owner (BHP) won’t let them. This is awful, we should absolutely be producing this critical mineral from this pile of mine waste. This mine is only idle because of a lack of corporate will. If only we had some sort of government regulation protecting our own production of critical minerals!
Zinc. Canada holds 1% of global zinc reserves. 10% of global zinc production comes from recycling. In 2019, Canada produced 299,000 tons of zinc from mines in MB, ON, QC, BC and NB. The New Brunswick mine is the Lead-Copper-Zinc mine in the Bathurst mining camp. This mine also produces the Lead that Surrette Batteries in Springhill NS uses to manufacture its world class batteries. In Nova Scotia, we have the open cast Scotia Zinc mine in Gays River. I visited that mine on a field trip in 2008 and it was idled a year later. Reason given: a decline in metal prices and increase in production costs. It might resume production in the coming year. But really, it should have never closed to begin with. It’s been sitting idle for 13 years not because we don’t need zinc, but only because the competition bought it so it could increase its own profits. If only we had some sort of government regulation protecting our own production of critical minerals!
The other critical minerals on Sean Kirby list
Titanium. Canada has 31,000 metric tons of ilmenite, the mineral that contains the element titanium. It’s all produced from one mine, the Titan mine in Ontario. In Nova Scotia, Titanium occurs in the sand bars of the Shubenacadie River. Any Nova Scotian who has crossed the Shubenacadie bridge at low tide, has seen the black sand bars in the river bed (weirdly, I don’t have a picture of that site myself). I remember talking with a prospector who hoped to produce the Titanium from those sands; that was about 15 years ago. It’s estimated to be a very large resource – just needs dredging. Readily sorted for you by natural processes. I think that such an operation would likely undermine a healthy and growing tourist industry in that area, and I haven’t done the math, but I’m guessing the tourism is better and more sustainable for the NS economy in the long run. I also think that massive dredging there would be adversarial to the ecology, but I don’t know enough about that. Up for debate.
Copper. There’s no question about the critical importance of copper. Natural Resources Canada tells us that more than half of Canada’s copper reserves are in BC, another 1/3d in Ontario and the rest in various other provinces, but not in NS. I can’t find literature on copper reserves in Nova Scotia, so I don’t know why Sean Kirby lists it. Yes, we’re looking at another massive wind turbine park in the making and wind turbines need a.o. lots of copper, but there simply isn’t a mineable reserve in our own Province.
Next?
We have only one planet and in order for humanity to survive, we need earth materials, a rich biodiversity and clean water for everyone. I urge the new Nova Scotia government to start a public discussion with the goal to arrive at a mineral extraction policy that is based in the acceptance of critical minerals and aims to contribute to the Canada Minerals and Metals Plan quoted above. Let’s do this soon, because the gold companies are aggressively moving forward to reap profits and destroy our environment for a resource that we don’t need, like magpies going after their bling.
Posted in climate change, critical minerals, mining, Nova Scotia, Uncategorized
4 Comments
Mining Association of Nova Scotia (MANS): Bullying, Propaganda, and a complete disregard for threatened natural habitats.
I published this post here on Dec 2, 2021. I submitted an excerpt to the Chronicle Herald the same day. The Halifax Examiner discussed it in their December 3 Morning File. Then the Herald published it on December 17, illustrated with a cartoon by Bruce MacKinnon. And on January 4, The Advertiser Register published the same piece as a guest column. I thank these media for giving me this exposure.
———————-
On November 15 and 16, I attended the virtual “Nova Scotia Precious and Critical Mineral Show” of the Mining Association of Nova Scotia (MANS). It was a technical symposium of two half days, each of which was introduced by a government official. The Monday morning was kicked off by brand new Minister of Natural Resources Tory Rushton and the Tuesday morning by Director of the NS Geological Survey Diane Webber (the only woman of the event). There were twelve talks. All the talks are posted here.
MANS is a member-based organization. 65 of its members are from the quarrying and mining business and 1 is law firm Cox and Palmer. It has a Board of Directors and two staff members, Sean Kirby and his wife Sarah, who operate from their home. MANS is a lobbying organization and a propaganda machine. In March 2020, the Halifax Examiner’s Joan Baxter wrote an excellent article about MANS’s not so subtle practices.
I’m a retired geologist, I’m fully aware that the energy transition requires a massive shift in material needs at a scale that almost nobody can imagine. This is an opportunity, but also a risk. Society has left resource extraction exclusively to the private sector, with the result that our planet is in a climate and biodiversity crisis that is also of a scale that almost nobody can imagine. Resource extraction typically makes a few people extraordinary rich but its societal impact costs all of us in environmental cleanup for decades or centuries after the extractive industry has upped and left. There’s hardly a good news story to tell.
In recent years, national and international agencies have formulated which critical minerals will play an essential role in our future. The Geological Survey of Canada has produced such a list as well. You can find it here. Highly reputable international organizations such as the EU and the World Bank have published superb and thought provoking reports on this urgent issue. See for example here and here and here and here. CBC reporter Alexander Panetta recently published an excellent article about Canada and its actual lack of critical minerals.

So I was interested in this symposium. Some observations:
- There wasn’t a single representative from any of the First Nations. Several years ago I attended a similar event in New Brunswick, which started with a sweet grass burning and smudging ceremony led by Mi’kmaq elders. I realize you can’t do that in a virtual symposium, but the complete absence of any First Nation representative was jarring.
- And – in extension to the above – not one speaker had the good manners to articulate a land acknowledgement. It’s been seven years since the Truth and Reconciliation Report was published but the colonial attitude of this sector clearly hasn’t changed one bit (there is also no land acknowledgement on the MANS website).
- The 12 technical presenters were all white men, a lot of them older than 60. I suppose that explains the above two points to some extent.
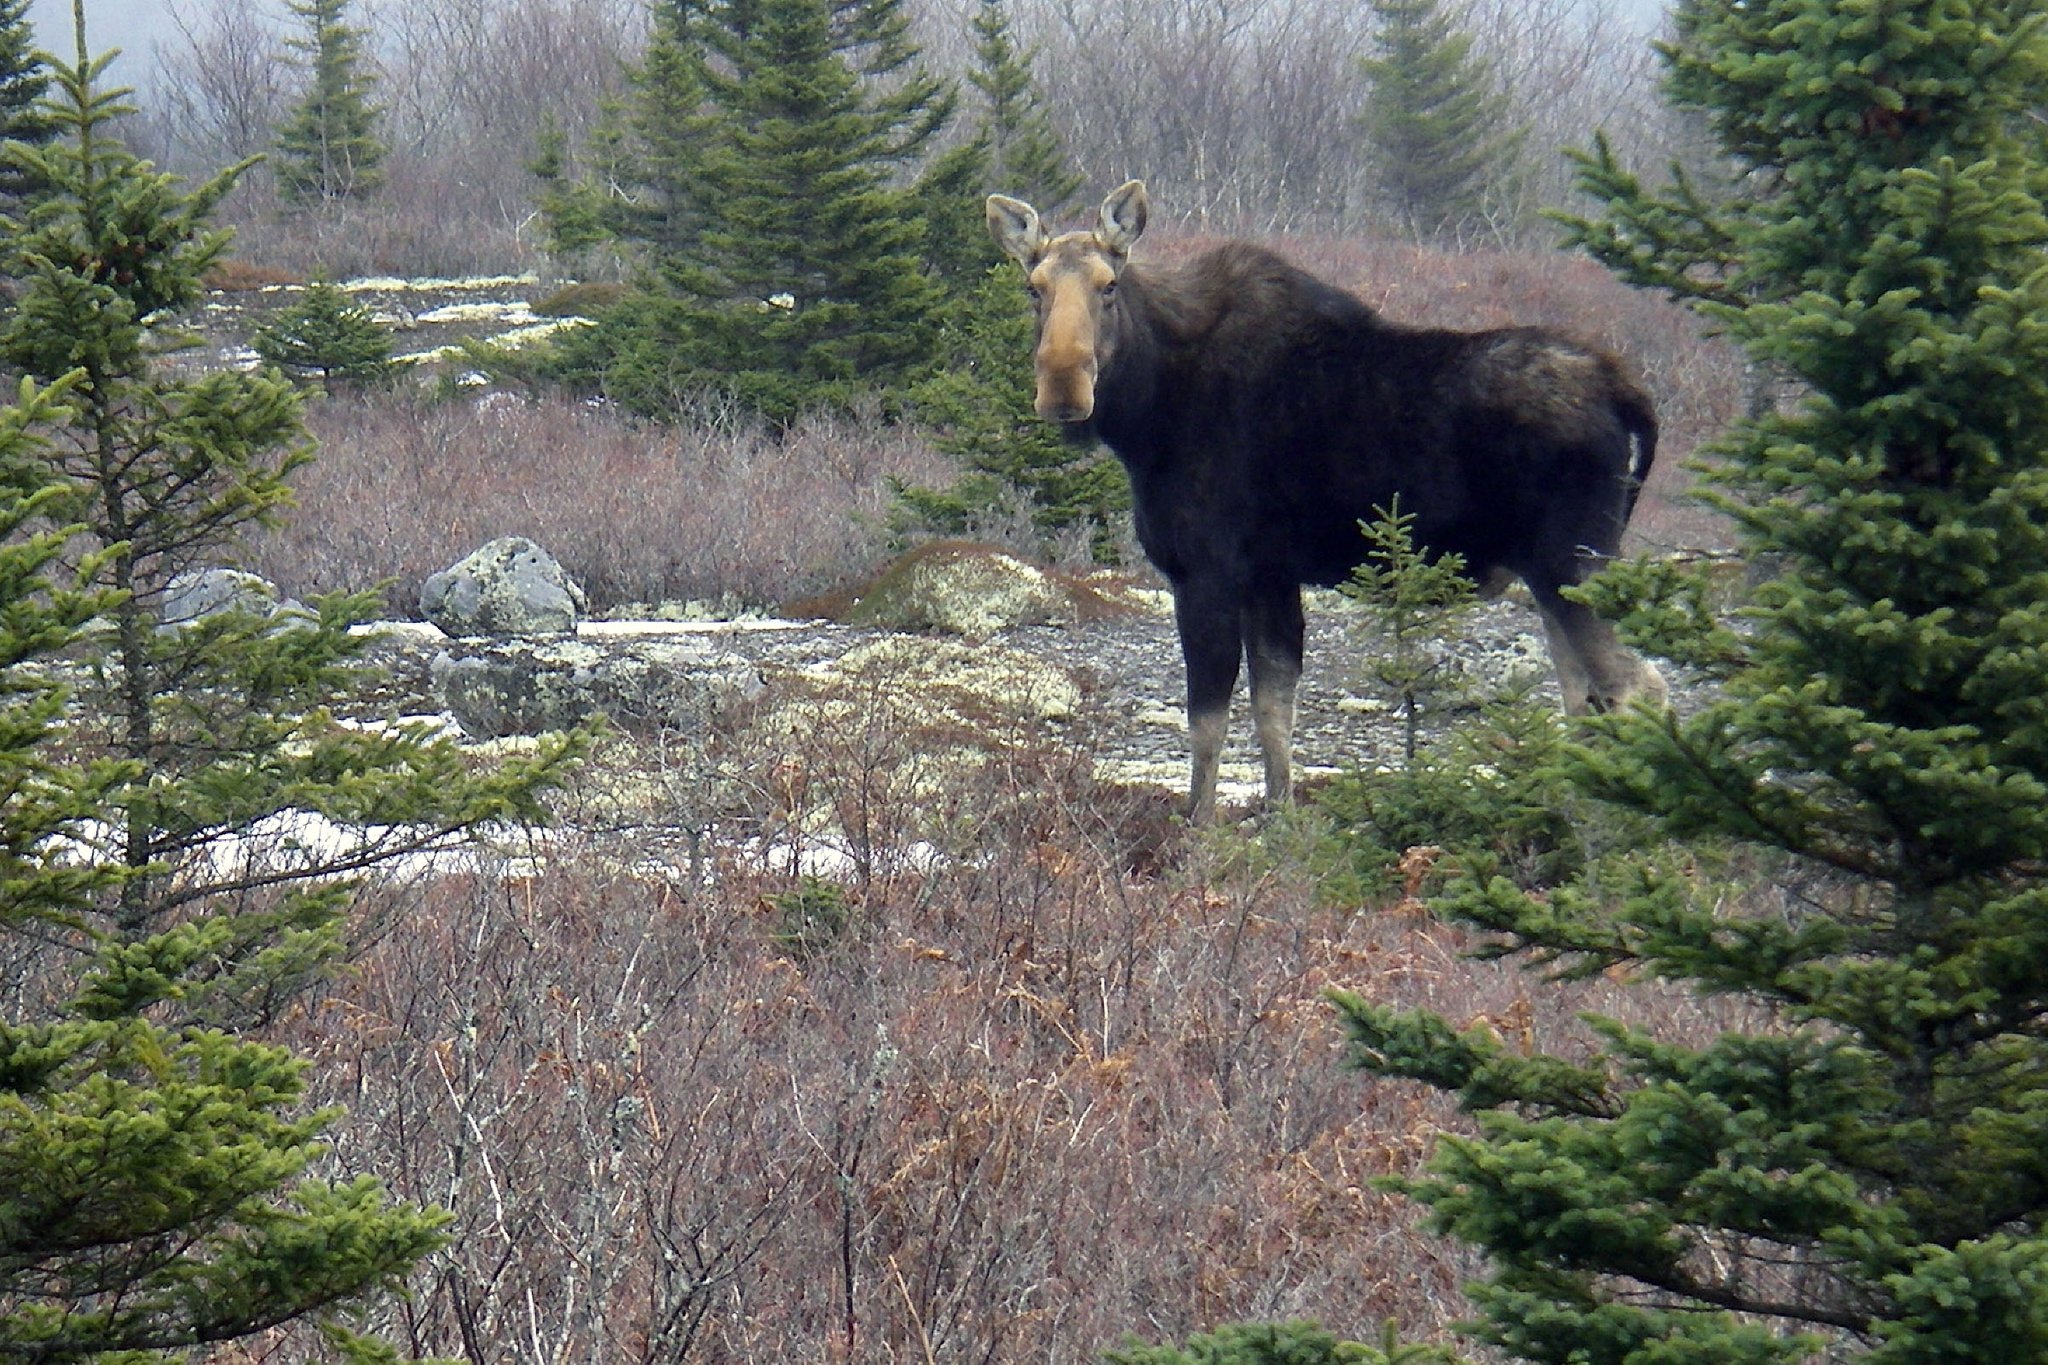
- Four presentations (two about critical minerals, two about gold) pertained to mineral claims located in southern Nova Scotia, in the highly fragmented habitat of the critically endangered Mainland Moose which has been much in the news because of clear cutting and protests against clear cutting. That area also happens to be a UNESCO Biosphere Reserve. None of the presenters mentioned this. One presenter, when asked about environmental aspects of a gold claim in that area sighed “well, there’s always something” and then mentioned that the area is the habitat of the eastern ribbon snake, a subspecies of “a very common snake”. Clearly he thought this was an annoying detail. Mainland Moose were not mentioned. Not one question was asked about habitat fragmentation in this area.
- Almost half of all presentations dealt with gold. In case you missed it: gold is a problem. It’s not a critical mineral (i.e. it isn’t essential for the energy transition), almost all of it is mined for jewelry or bullion and since it’s completely inert, the bit that we do need for medical and technical applications can easily be obtained from recycling (if we had the right processes in place). See the article by Joan Baxter mentioned above. But MANS (Sean Kirby) and its members push gold relentlessly and the less informed citizen is led to believe that it’s a really important mineral, when not one National or International Agency lists it as such. One of the presenters, frustrated by the stalling of the exploration of a gold claim in Cape Breton as a result of objections by First Nations, admitted that Gold isn’t a critical mineral but that “we need to mine gold to pay for developing other minerals”. Sean Kirby enthusiastically agreed. Really? I’m sorry but this is a strange financial model, one that is valid only if we leave the development of natural resources exclusively to the (taxpayer sponsored) private sector. If we as a society create a different model for producing the materials that society needs rather than just the stuff it wants, then this statement no longer holds water. Director Webber politely refrained from comment when asked by MANS-man Sean Kirby about progress on this project (she also wisely refrained from comment when he pressed her about the Nova Scotia Uranium ban).
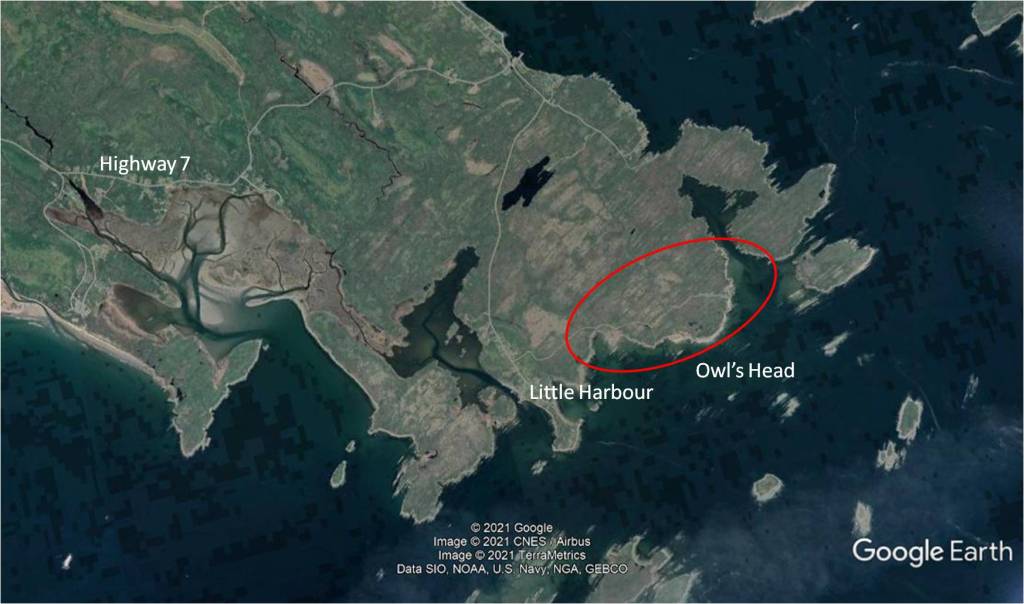
- One presenter who reported on yet another future gold mine in eastern Nova Scotia shrugged a question about environmental impact off with “there’s just some stunted trees and bogs there”. I would like to remind the entire resource sector that this is exactly what the developer of Owl’s Head thought he was buying: stunted trees and bogs on a headland sticking out in the ocean. And maybe the mining sector should begin to read about the importance of wetlands as critically important habitat and carbon sinks (see for example here). The same speaker also triumphantly reported that when they contacted the local community about the potential impact of the mine “all we got were resumes”. Gleeful snickering followed plus a few off-hand remarks about the excellent working conditions in the sector. Of course this statement can’t be checked, it said more about the attitude of the sector than about the reality.
Only one presentation impressed me. It was by Don Bubar, the President and CEO of Avalon Advanced Materials, a Toronto-based company. Mr Bubar talked about the possibilities for extracting Tin and Indium, both critical minerals, from mine waste at the historic East Kemptville mine in South Nova Scotia. Mr Bubar talked about the need for a circular economy and about the innovations necessary in order to extract critical minerals from mine waste. This talk made my day.
Nova Scotia nor the rest of the world needs another gold mine. The currently operating Touquoy gold mine site is a 300 hectare (561 football fields) hole in the ground and the proposed Beaver Dam gold mine will be 1.5 times that large. Touquoy has already been charged with at least 32 environmental violations.
This month Nova Scotians have an opportunity to provide feedback on the potential development of the Beaver Dam gold mine in eastern Nova Scotia. The Halifax Examiner’s Joan Baxter wrote about the stiff resistance to this plan here. The CBC’s Frances Willick also reported on this project. In case you want to send feedback on this mine proposal, that page is here
MANS is useless. It actively undermines a balanced discussion about our role as humans on a planet ever more under threat. It could be making a contribution to helping Nova Scotians navigate the discussion about our role as humans on a planet that suffers from habitat destruction in a manner that is now jeopardizing humanity’s own future. But no. MANS’s only objective is to reduce government interference in their ambition to disembowel our Province as much as possible. Their website states that the government’s goal of protecting 13% of Nova Scotia is too much (the current government has increased that to 20% by the way). They pay lip service to “environment” but they mostly waffle about how reclamation makes old quarry pits and open cast mines “beautiful”, thus completely ignoring the fact that wilderness is incomparable with reclaimed mines turned into parks. They refer to the term “critical minerals” only as a justification towards their goal of private profit without providing any deeper insight. They make no contribution to a balanced debate that we so badly need. Anyone who raises the slightest objection to their bullish talking points is called an obstructing environmentalist and is blocked from their social media platforms.
The Earth Resources industry sector has the Nova Scotia government in its pocket, just like the Forestry sector does. Unless citizens force deep and profound changes in the manner in which we treat the natural wealth that we’re responsible for, catastrophic climate change and biodiversity collapse will continue unabated. We still have a chance, in Nova Scotia, and we’ve made a few gains (Alton Gas and Owl’s Head are recent small wins) but as long as organizations such as MANS continue with their opportunistic and bullish propaganda, brainwashing those who haven’t had the opportunity to delve deeper into the subject, I’m not optimistic.
Posted in critical minerals, General geoscience, mining, Nova Scotia
4 Comments
“Canadian company @Recon_Africa drills for oil in the Okavango delta watershed”
This post was originally published on August 5, 2021. It has been updated a few times, lastly on March . The updates that appeared here earlier have been moved to the end of this blog post. The original content has been extensively updated.
On November 5, 2021 ReconAfrica publicized its first three seismic lines. These lines represent 150 km of the 450 km the company collected. They can be viewed here and here. The data show that the Kavango subsurface “basin” is less than half the depth of the Owambo Basin to the west. This observation is in conflict with ReconAfrica’s claims of an ‘extremely deep basin’ in the Kavango area (which the company has called the Kavango basin).
On November 16, 2021, Windhoek-based former petroleum geologist Matt Totten Jr gave a talk to the Namibia Scientific Society on the regional subsurface geology of the Kavango area. He demonstrated that there is no deep sedimentary basin and that ReconAfrica is (deliberately?) sowing confusion about its data and interpretations in order to stave off criticism of its operations. The talk is posted here. Matt Totten also demonstrates convincingly that ReconAfrica is drilling in the shallow eastern extent of the Owambo basin, something I had suspected all along and something of which ReconAfrica is accused of in a civil lawsuit filed against the company (see below). My own interpretation of the geology of this case is essentially the same as Matt Totten Jr’s interpretation. We have arrived at these conclusions independently of each other.
I have updated the content of my original post with this information, and I include my view of a talk that Dr James Granath, a petroleum geologist / consultant, who is based in Denver (CO) and is a director of ReconAfrica gave to the Houston Geological Society on October 25. I have also included comments on the recent article by James Granath and others, published in the Journal of Structural Geology.
Rolling Stone Magazine published an article by Jeff Goodell on March 26, 2023. The article quotes Dr Paul Hoffman, a well known geologist with a life time of research experience in Namibia. Dr Hoffman states that it’s naieve to think that there’s petroleum here. He was not aware of this blog post when interviewed. This makes three geologists (Matt Totten, Paul Hoffman and myself) coming to the same conclusion independently of each other: there is no basin here, there is no oil here.
Here is another recent article about one of the kingmakers behind ReconAfrica, mr Jay Park. Draw your own conclusions.
Original post, published August 5, 2021 last updated August 6, 2022
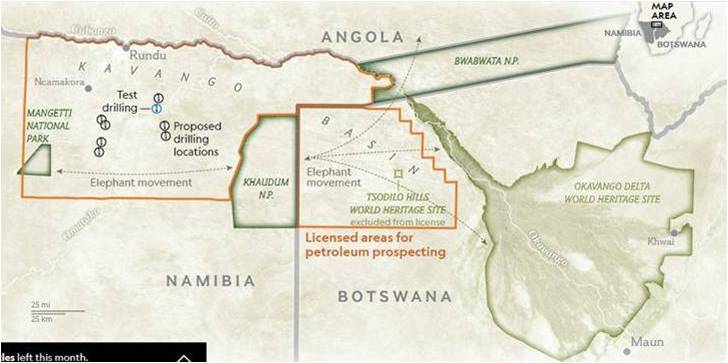
The title of this story is paraphrased from several headlines over the last few months. There was public outrage over the fact that Recon Africa was allowed to drill in elephant migratory territory in northeastern Namibia. Much was also written about the company being suspected of being dishonest about its objectives and basis for investment. The Globe and Mail’s journalist Geoffrey York (@geoffreyyork) wrote no fewer than eight articles about the issue (here, here, here, here, here, here, here, and here; all other literature cited is listed at the end of this blogpost).
I was intrigued. What is actually going on? The media focused on supposedly shady investment practices, but not really on the geology. So here is a bit of geologic background. I only started reading about this case because I was disturbed that yet another Canadian resource company was reported to be behaving unethically in a country in the Global South. It seems there isn’t a day that we don’t read about these sorts of issues and that really disturbs me as a Canadian. Whereas the reporting focused on ReconAfrica’s shady practices of attracting investments, I decided to try to understand the geology, because that is the basis for investment.
I studied the geologic literature relevant to this part of the world, including literature pertaining to oil and gas (O&G) production. I conclude that ReconAfrica might be exploring in what they call the Kavango Basin (hitherto undocumented by anyone else), but that this area might also be an undocumented extension of the well documented Owambo/Etosha basin. Their exploration target is either a previously undocumented Permian shale interval, which would likely require hydraulic fracturing (fracking) in order to produce hydrocarbons or a deeper situated interval of Proterozoic Otavi Group limestones, which might or might not require fracking. It is unclear which interval they are targeting because they report both ‘shales’ and ‘carbonates’ (=limestones)’ as their hydrocarbon target rocks. The Namibian government states that it doesn’t allow fracking.
ReconAfrica filed an Environmental Assessment Report in January 2020 which states that elephants aren’t sensitive to the vibrations resulting from seismic exploration (Risk Based Solutions, 2020).
ReconAfrica has drilled 2 stratigraphic wells and has acquired 450 km of traditional 2D seismic data.
Background
First a bit of basics on hydrocarbon exploration. Hydrocarbons (either oil or gas) are locked in rocks in the earth’s subsurface. How do they get there?
- Oil may be formed when organic rich deposits (sediments) are buried and – given the right temperature and pressure regimes over time at great depths – become ‘cooked’ and convert into hydrocarbons. Rocks are buried and twisted and turned (folded) and broken up (faulted) because the earth’s crust consists of tectonic plates that move around while oceans form and close and in this way rocks get buried in the deep subsurface and/or are thrown up as mountains. What kind of organic rich deposits may be transformed into oil? Algal mats (cyanobacteria) or microscopic single cell organisms that float in oceans and lakes and are buried after the death of the organism (before being eaten by a predator). We’re talking billions of creatures and millions of years.
- Natural gas is formed when marsh and swamp deposits pile up as peat and are buried under sufficient pressure and temperature to become coal. Coal may then degas to yield natural gas, given the right conditions. This process too takes millions of years.
Both oil and gas, once formed, are very mobile and – given the right conditions – migrate from their position under pressure in the subsurface to a location with less pressure, if the geology allows it. And in this way hydrocarbons may become trapped in what’s called a “Reservoir”. A Conventional Reservoir is a rock that has enough porosity (holes) and permeability (connections between holes) to hold hydrocarbons. If the rocks surrounding the Reservoir don’t allow for further movement of the oil or gas, then the Reservoir is sealed. If you sink a well into a reservoir, you create an opening to a medium (the earth’s surface atmosphere) with less pressure than at depth and the oil or gas flows upward. Bingo!
Until about 15 years ago, most oil or gas was recovered from such Conventional Reservoirs, rocks with enough porosity and permeability (not every conventional reservoir produces easily, there are lots of ‘stimulation techniques’, but that goes too far for this blog post). Then came the fracking boom.
The organic rich rocks that contain oil and gas are called Source Rocks – as opposed to Reservoir Rocks. Source Rocks are usually shales, hence they have very low permeability, and hence the oil or gas stays put. These rocks are ‘tight’. Fracking (hydraulic fracturing) is a technology whereby you sink a well into a source rock and blast the subsurface with fluids under very high pressure. In that way you create artificial permeability so that you can force the hydrocarbons up your well. The Source Rock has become a Reservoir Rock through this technology. These are called Unconventional Reservoirs.
Hydraulic fracturing (fracking) is controversial because it requires a vast amount of water and chemicals injected under high pressure. After having done its job, the water is then contaminated and will have to be contained in tailings ponds until it’s cleaned up. It’s also really expensive because you need a lot more wells than when you produce from a Conventional Reservoir. Because even though you have created artificial porosity and permeability, the rocks are still tight and you need lots and lots of wells. And all those wells cause a huge disruption in the landscape (i.e. the earth surface’s ecosystems). Just travel to Bakken, North Dakota on Google Earth to get an idea. Because of these problems, fracking is banned in some jurisdictions (e.g. NY State, New Brunswick). The fracking boom has died down quite a bit because drilling so many wells is extremely expensive and the Returns On Investment (ROI) have been below expectations.
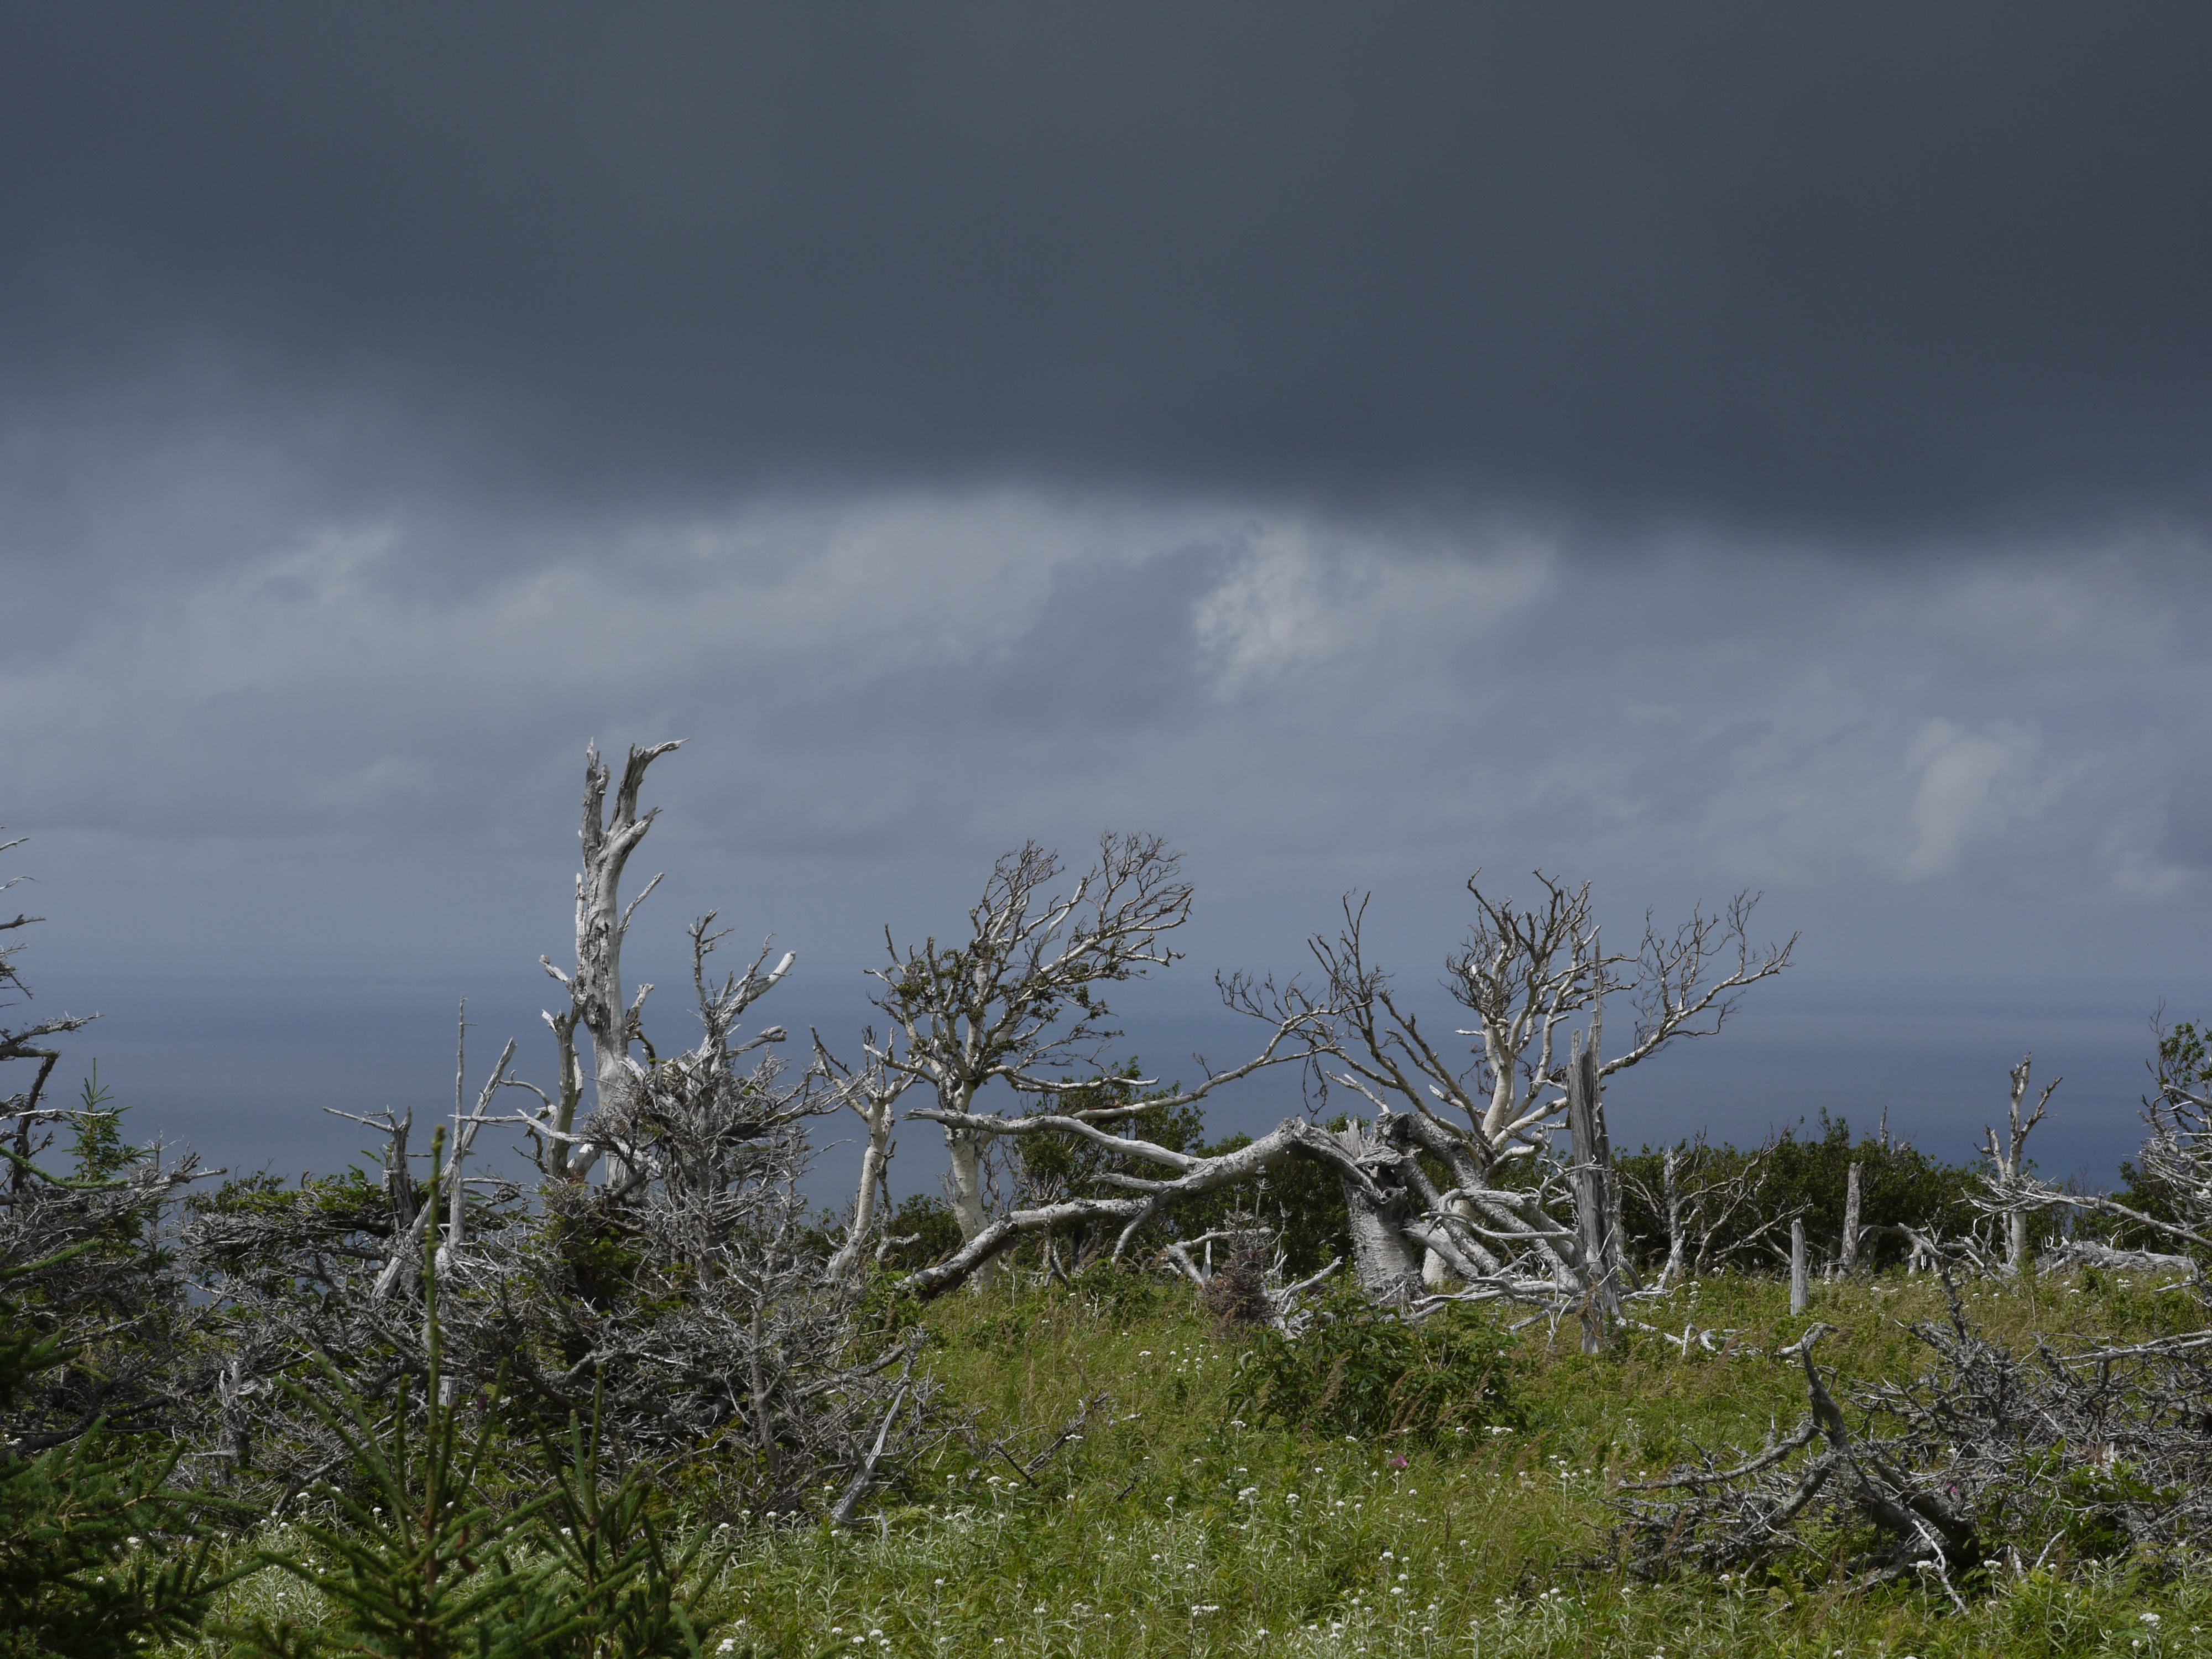
Namibia doesn’t allow fracking. This makes sense because it is a desert country, i.e. has water scarcity. ReconAfrica’s Area of Interest (AOI) in northeastern Namibia is a very thinly populated dry desert. What little water flows through there, is part of the headwaters of the iconic Okavango delta, a UNESCO World Heritage site.
Geologists are employed by oil companies to predict where hydrocarbons (oil and gas) are ‘ahead of the drill’. Because drilling is expensive, companies acquire the maximum amount of geologic information using cheaper methods (hands-on fieldwork, seismic data, aeromagnetic data, gravity data) to get the best possible understanding of the geology before making the decision to drill.
Seismic exploration uses shock waves set off by the explosives that travel through the subsurface, bounce off differentially from rocks that have different densities and are then reflected back, thus forming an image of the stratigraphy (layers) and structure (folds and faults) of the subsurface. Good quality seismic data may also indicate the presence of hydrocarbons. In the distant past, before the availability of such advanced imaging technology, companies sometimes just sunk a well because they thought they understood the geology well enough. This process is called wildcatting. It doesn’t really happen anymore because the risk of wasting a lot of money on drilling in the wrong place is too high. ReconAfrica drilled two test wells (in May and June of this year) before collecting seismic data (July and August).
The Owambo-Etosha basin and eastern Kavango area
A sedimentary basin results when the earth’s crust descends and surrounding high land erodes and the sediments drain into the newly formed topographic low. The land erodes and the sediments are deposited in the basin. The sediments may contain organic rich intervals, also called strata.
Other sedimentary basins may form when, given the right latitude and ecosystem parameters, limestone forming reefs and algal mats accrete along the edges of tropical seas.
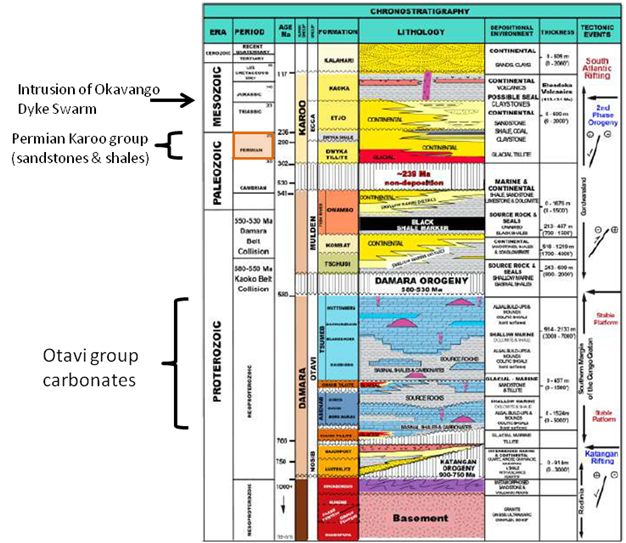
The colours are fairly intuitive. Blue-coloured intervals represent carbonate rocks (limestones), yellow and brown-coloured intervals represent various sandy and gravelly strata. Black intervals represent shale. Pink and purple indicate igneous rocks (rocks that come up from the depth of the earth’s crust, such as granites and basalts. These rocks never contain organic matter). Vertical-striped intervals mean that no rocks represent that time interval, i.e. there is a hiatus in the rock record.
The target interval in the Owambo/Etosha basin is the 500-700 million year old Otavi Group, consisting of mostly carbonate rocks (=limestones). The target interval in the hitherto undocumented Kavango basin is supposedly the 250-300 million year old Permian Karoo Group of sandstones and shales
Decades of research in southern Africa have resulted in a good understanding of its geologic history. One way to visualize that history is with a (schematic) stratigraphic column, which depicts the known stack of rocks from subsurface to surface in a certain region, plotted against time. It tells, schematically, what happened in that region over a long period of time. The stratigraphic column shown here covers 1 billion years of geologic history in the general area of the Owambo/Etosha Basin, indeed a very schematic representation.
The stratigraphic column doesn’t tell you whether the rocks are folded or faulted. In this figure, the three far right columns list the various depositional and mountain building events and the thickness of the different rock units. These columns add to the story.
The Owambo basin’s western extent is well known and documented, its eastern margin was never well known. Part of the reason is that the rocks are buried below a thick sequence of more recent Kalahari sands and part of the reason is that this area is still littered with land mines.
What is the history of hydrocarbon exploration in this part of the world?
The Owambo/Etosha basin was formed as a result of tectonic processes. It contains a thick pile of sediments and was explored for hydrocarbons in the 1960s and 70s. Seismic data were collected at that time and five wells were drilled. Four of them were dry holes, one well (Etosha 5-1A) had a bit of an oil showing.
The drilling at the time targeted the 500-700 million year old Otavi Group which consists of shallow marine algal limestones. There was no life on land yet in those days and life forms in the oceans didn’t have exterior skeletons (shells). These cyanobacteria built up mounds of algal material. If you wonder what that would have looked like, modern day Shark Bay (a UNESCO world heritage site) in western Australia is an analogue for that kind of environment. Although these rocks have been buried for a very long time, they didn’t go “through the oil window” (they didn’t get “cooked”) and no hydrocarbons were really generated in the Otavi Group, at least not in the western Owambo/Etosha basin.
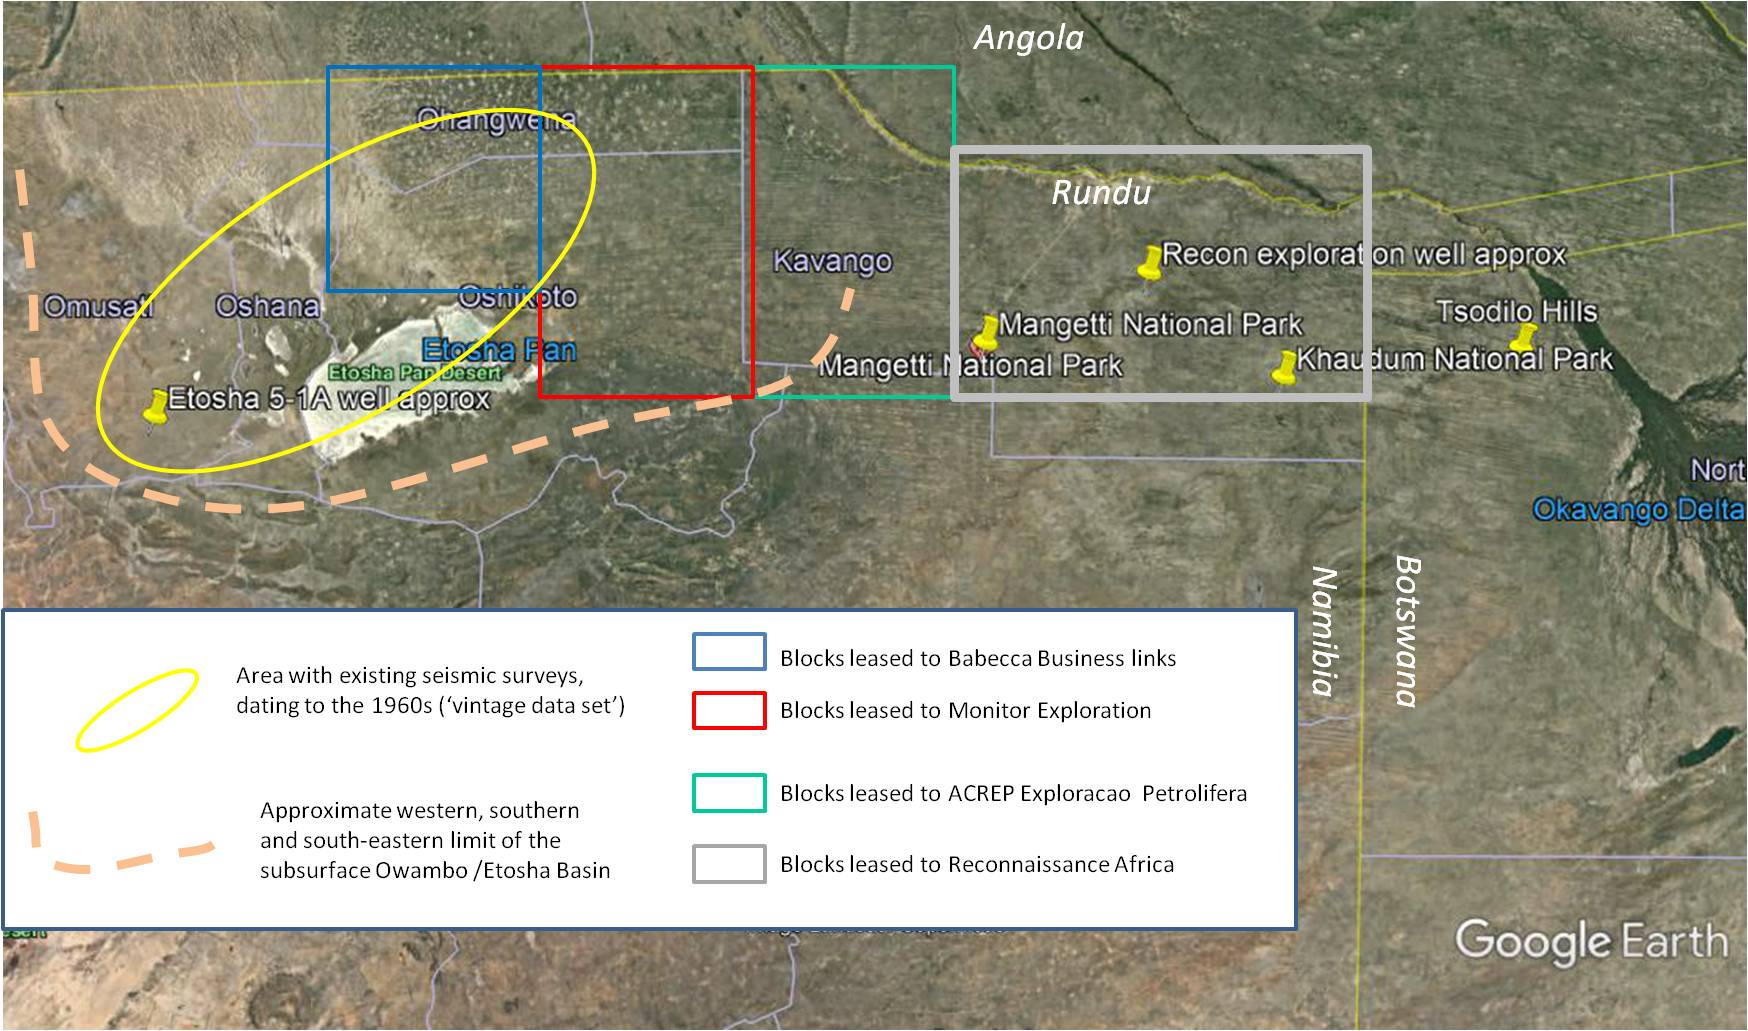
Millions of years passed after the deposition of the Otavi Group (lots happened, but too much to address here) and now we’re in the Permian, a geologic period that lasted from roughly 300-250 million years ago. At this point in time, what is now Namibia was situated at a mid to high southern latitude and the large Kalahari basin was formed. Most of the rocks here are deposited as sand and mud on land and in shallow bays and estuaries. The deep sea was far away, because this was the time of the supercontinent Pangea. These rocks are the rocks of the Karoo sequence. They have been studied extensively.
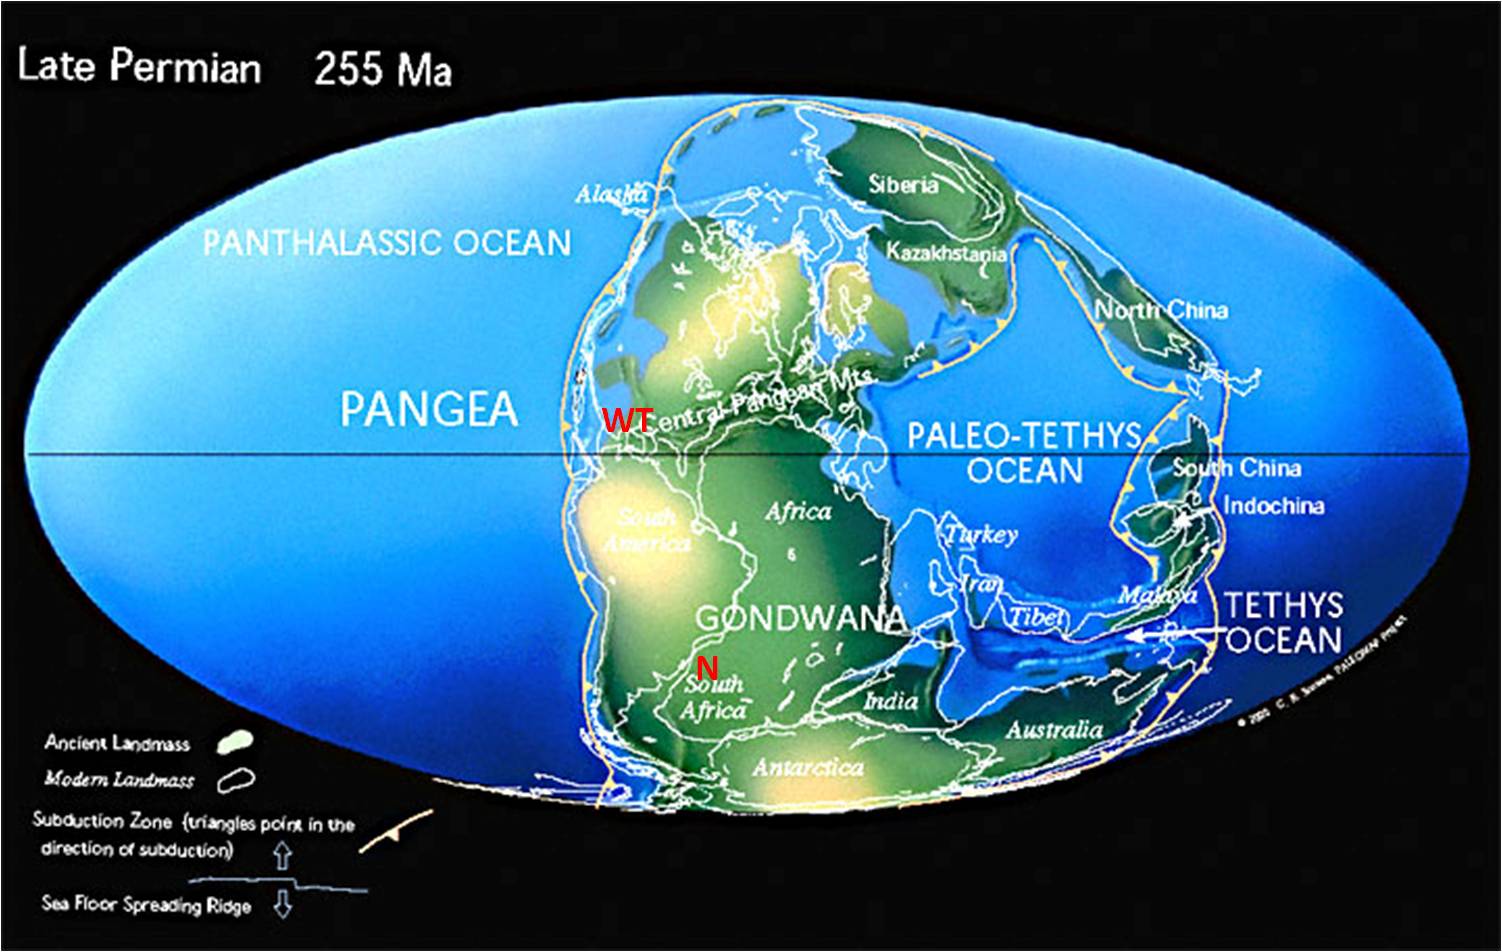
After the Permian, the supercontinent slowly began to break up. Great rifts formed in the earth (more or less the way the Great African Rift is formed now) and cracked the earth’s crust, forming localized deep basins.
By the early Jurassic, ca. 200 million years ago, continental break-up intensified and magma from deep down the crust welled up, forming so-called ‘dyke swarms’. One such dyke swarm is the Okavanago Dyke Swarm (ODS) which formed around 180 million years ago.
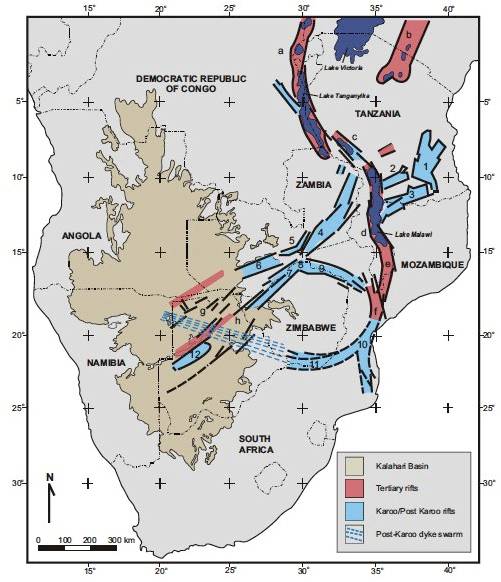
Several papers, a.o. those by Granath and Dickson (see references at the end of this blog post) suggest that the Karoo and post Karoo rift basins extend further into NE Namibia forming what they call the Kavango Basin. The existing literature doesn’t suggest the existence of such a basin: Corner (2000) even shows abrupt shallowing here. But a basin may of course have been missed in the past. The area was the site of guerilla warfare until 1990 and got riddled with land mines; it was therefore very inaccessible. More recently acquired aeromagnetic surveys have unveiled the presence of the Kavango Basin, at least according to ReconAfrica’s geologists. In a June 2021 webinar, Jim Granath suggests an intricate tectonic model for the Southwest African Rift systems, resulting in what we call a pull-apart basin, which is what he calls the Kavango Basin. I’ll come back to this proposal further down in this blog post.
What is ReconAfrica doing?
ReconAfrica’s founder and majority shareholder Craig Steinke stated that he found a “vintage set of data” and that this find led to the discovery of a completely new play (a play is a stratigraphic and geographic interval with comparable characteristics favourable for hydrocarbon production) in the Permian Karoo stratigraphic interval and that the discovery and analysis of this set led the company to position their stratigraphic wells (they brought the drill rig in all the way from Texas – during the pandemic). They filed their stratigraphic well reports but they didn’t include the log of the well “because they have no reserves”. This may be an odd statement, but it’s based on an independent evaluation (Sproule report, 2020) which uses only probabilistic methods in the absence of actual data. Quoting the Sproule report: “The leads on …. ReconAfrica’s leases …. land carry very high risk because all geological risk factors are poorly defined with almost no information available at the present time”.
The aeromagnetic data is shown below. It is puzzling why this data set would get anyone excited about the Kavango area. Because the colours (darker blue for greater depth, lighter blue for shallower, brown for very shallow) show that the “proposed Kavango Basin” is shallower than the Owambo basin.
The Owambo basin was formed as a result of the collision of continental fragments more than half a billion years ago. Geologists call it a “Foreland basin”. A foreland basin forms as a reaction to a tectonic load elsewhere. Its width is determined by how the earth’s crust responds to a load. There is no evident Permian-age load in NE Namibia, 1300 km north of the Karoo basin, hence a deep basin here is physically impossible. Earlier exploration showed that the target rocks in the Owambo Basin (the Otavi Group limestones) were not oil-bearing and that exploration campaign was abandoned. A 1979 paper by Clauer and Kroner, using the well samples from this original drilling campaign, demonstrated that the rocks in the target interval experienced “low-grade metamorphism”, meaning that they experienced significant heat and pressure long after burial or – in lay language – these rocks were ‘cooked’ to the extent that any hydrocarbons evaporated out of them a long time ago.
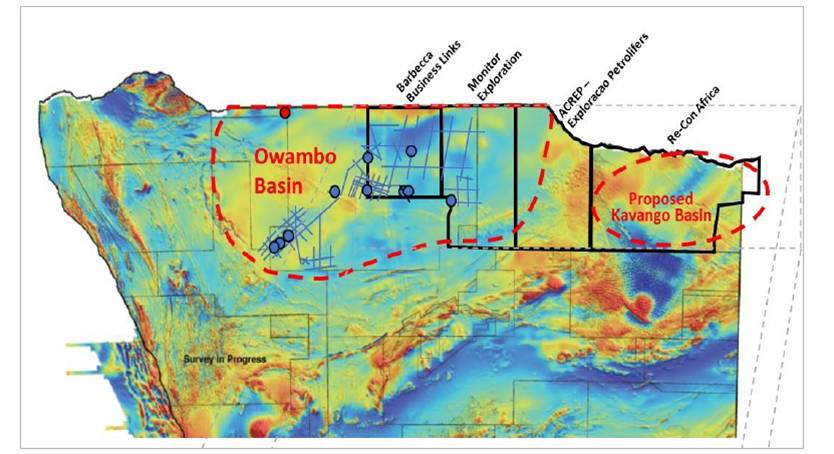
Quoting the Environmental Assessment Report by RBS (2021): “Reconnaissance Energy Namibia has interpreted high resolution aeromagnetic data documenting a very deep untested Kavango basin with optimal conditions for preserving a thick interval of organic-rich marine shales in the lower portion of the Karoo supergroup. Reconnaissance Energy Namibia’s interpretation strongly suggests that the formational equivalents to the lower Ecca Group (Permian) will be preserved in the untested deeper portion of the Kavango basin. The company believes that these target sediments lie in a previously unrecognized Karoo basin along major trans-African lineaments that link NE Namibia to the better known Karoo rift basins in eastern Africa”.
This statement is in conflict with the company’s own published aeromagnetic map as is the figure below, which used to be featured on the company’s website, but has since disappeared.
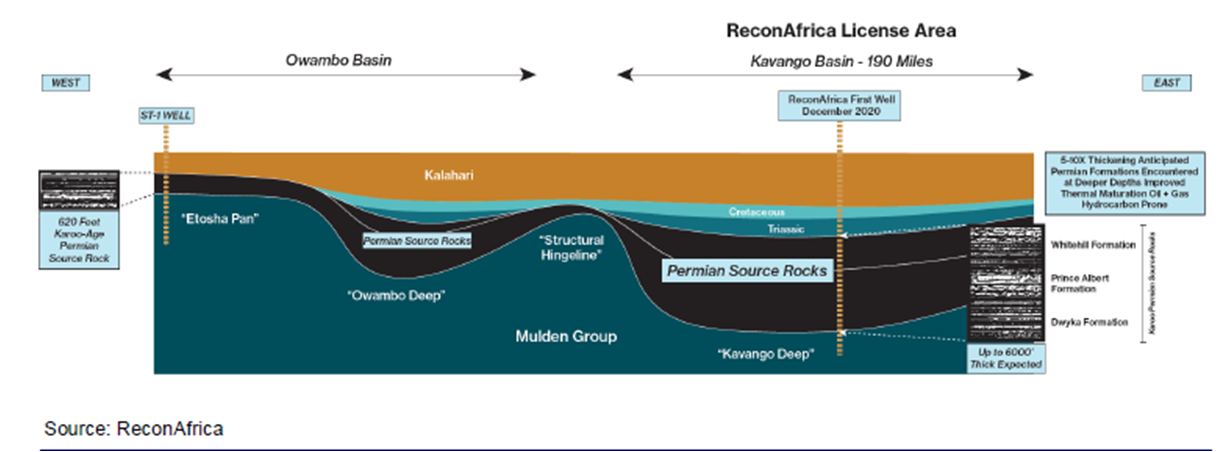
Below is another schematic cross section published by ReconAfrica. This one also has no vertical scale. The seismic data now available give more detailed and very different interpretation. I’ll discuss these below. The figure shows that ReconAfrica is targeting the Permian age shale intervals of the Prince Albert and Whitehill equivalent Formations. The ST-1 well in the Owambo-Etosha basin had a small oil showing in Proterozoic Otavi limestones. The light blue Owambo Formation is part of the Mulden Group. The brown lowermost interval thus represents the Otavi Group. Note that the figure suggests that “things deepen to the East” a suggestion that is in conflict with the aeromagnetic data shown in figure 6. It is also in conflict with scientific literature, which doesn’t document the existence of the Whitehall (equivalent) and Prince Albert Formations in the subsurface of NE Namibia.
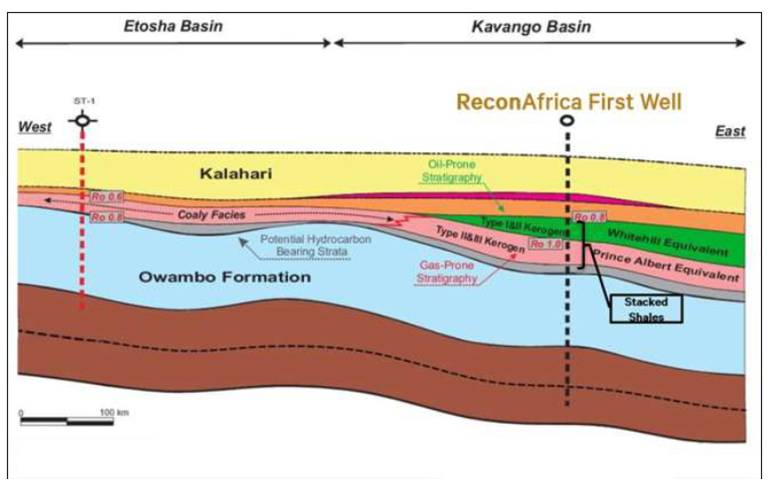
Below is a paleogeographic reconstruction of the area during the late Permian when the Whitehill and Albert Formation shales were deposited. To the left if a figure by ReconAfrica, to the right a figure from an authoritative comprehensive review article by Catuneanu et al (2005). That article doesn’t show any Whitehall/Prince Albert shales in the Kavango area (purple arrows). A more recent PhD dissertation (Werner, 2006) also doesn’t show the presence of marine deposits in this area.
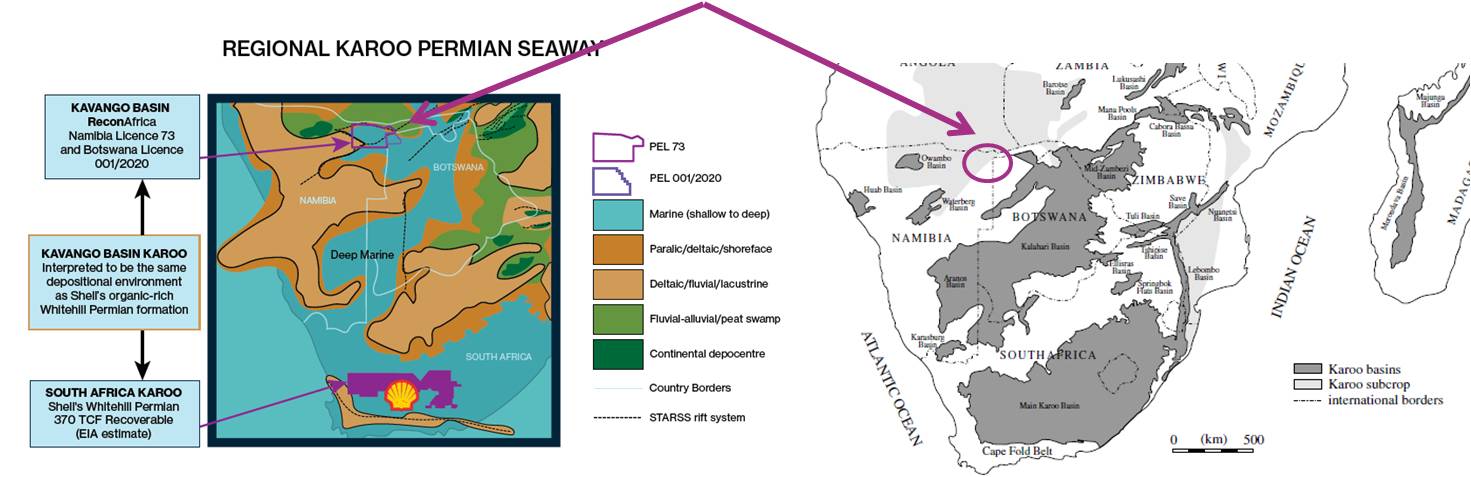
Before we get to ReconAfrica’s well and seismic data, let’s look at data from another company in the area. Figures 3 and 6 show two other lease blocks. The blocks edged in red in figure 3 are leased to Monitor Exploration Ltd. MEL makes clear they’re exploring the Owambo basin. They state: “The Owambo basin is probably the most important area in terms of hydrocarbons exploration onshore Namibia. Its stratigraphy comprises rocks from Pre-Cambrian times till the Tertiary cover of the Kalahari Sands Formation with a total thickness up to 8,000m. Otavi Group, a Neoproterozoic carbonate platform, represents the main target”. MEL also states that “aeromagnetic data suggest that there are features associated with magmatic intrusions that may have affected the petroleum system.” Are they referring to the Okavango Dyke Swarm? Or are they referring to the younger Etendeka volcanics? MEL also published a seismic section. Matt Totten correlated that seismic section with the seismic sections of ReconAfrica. The result is shown here.
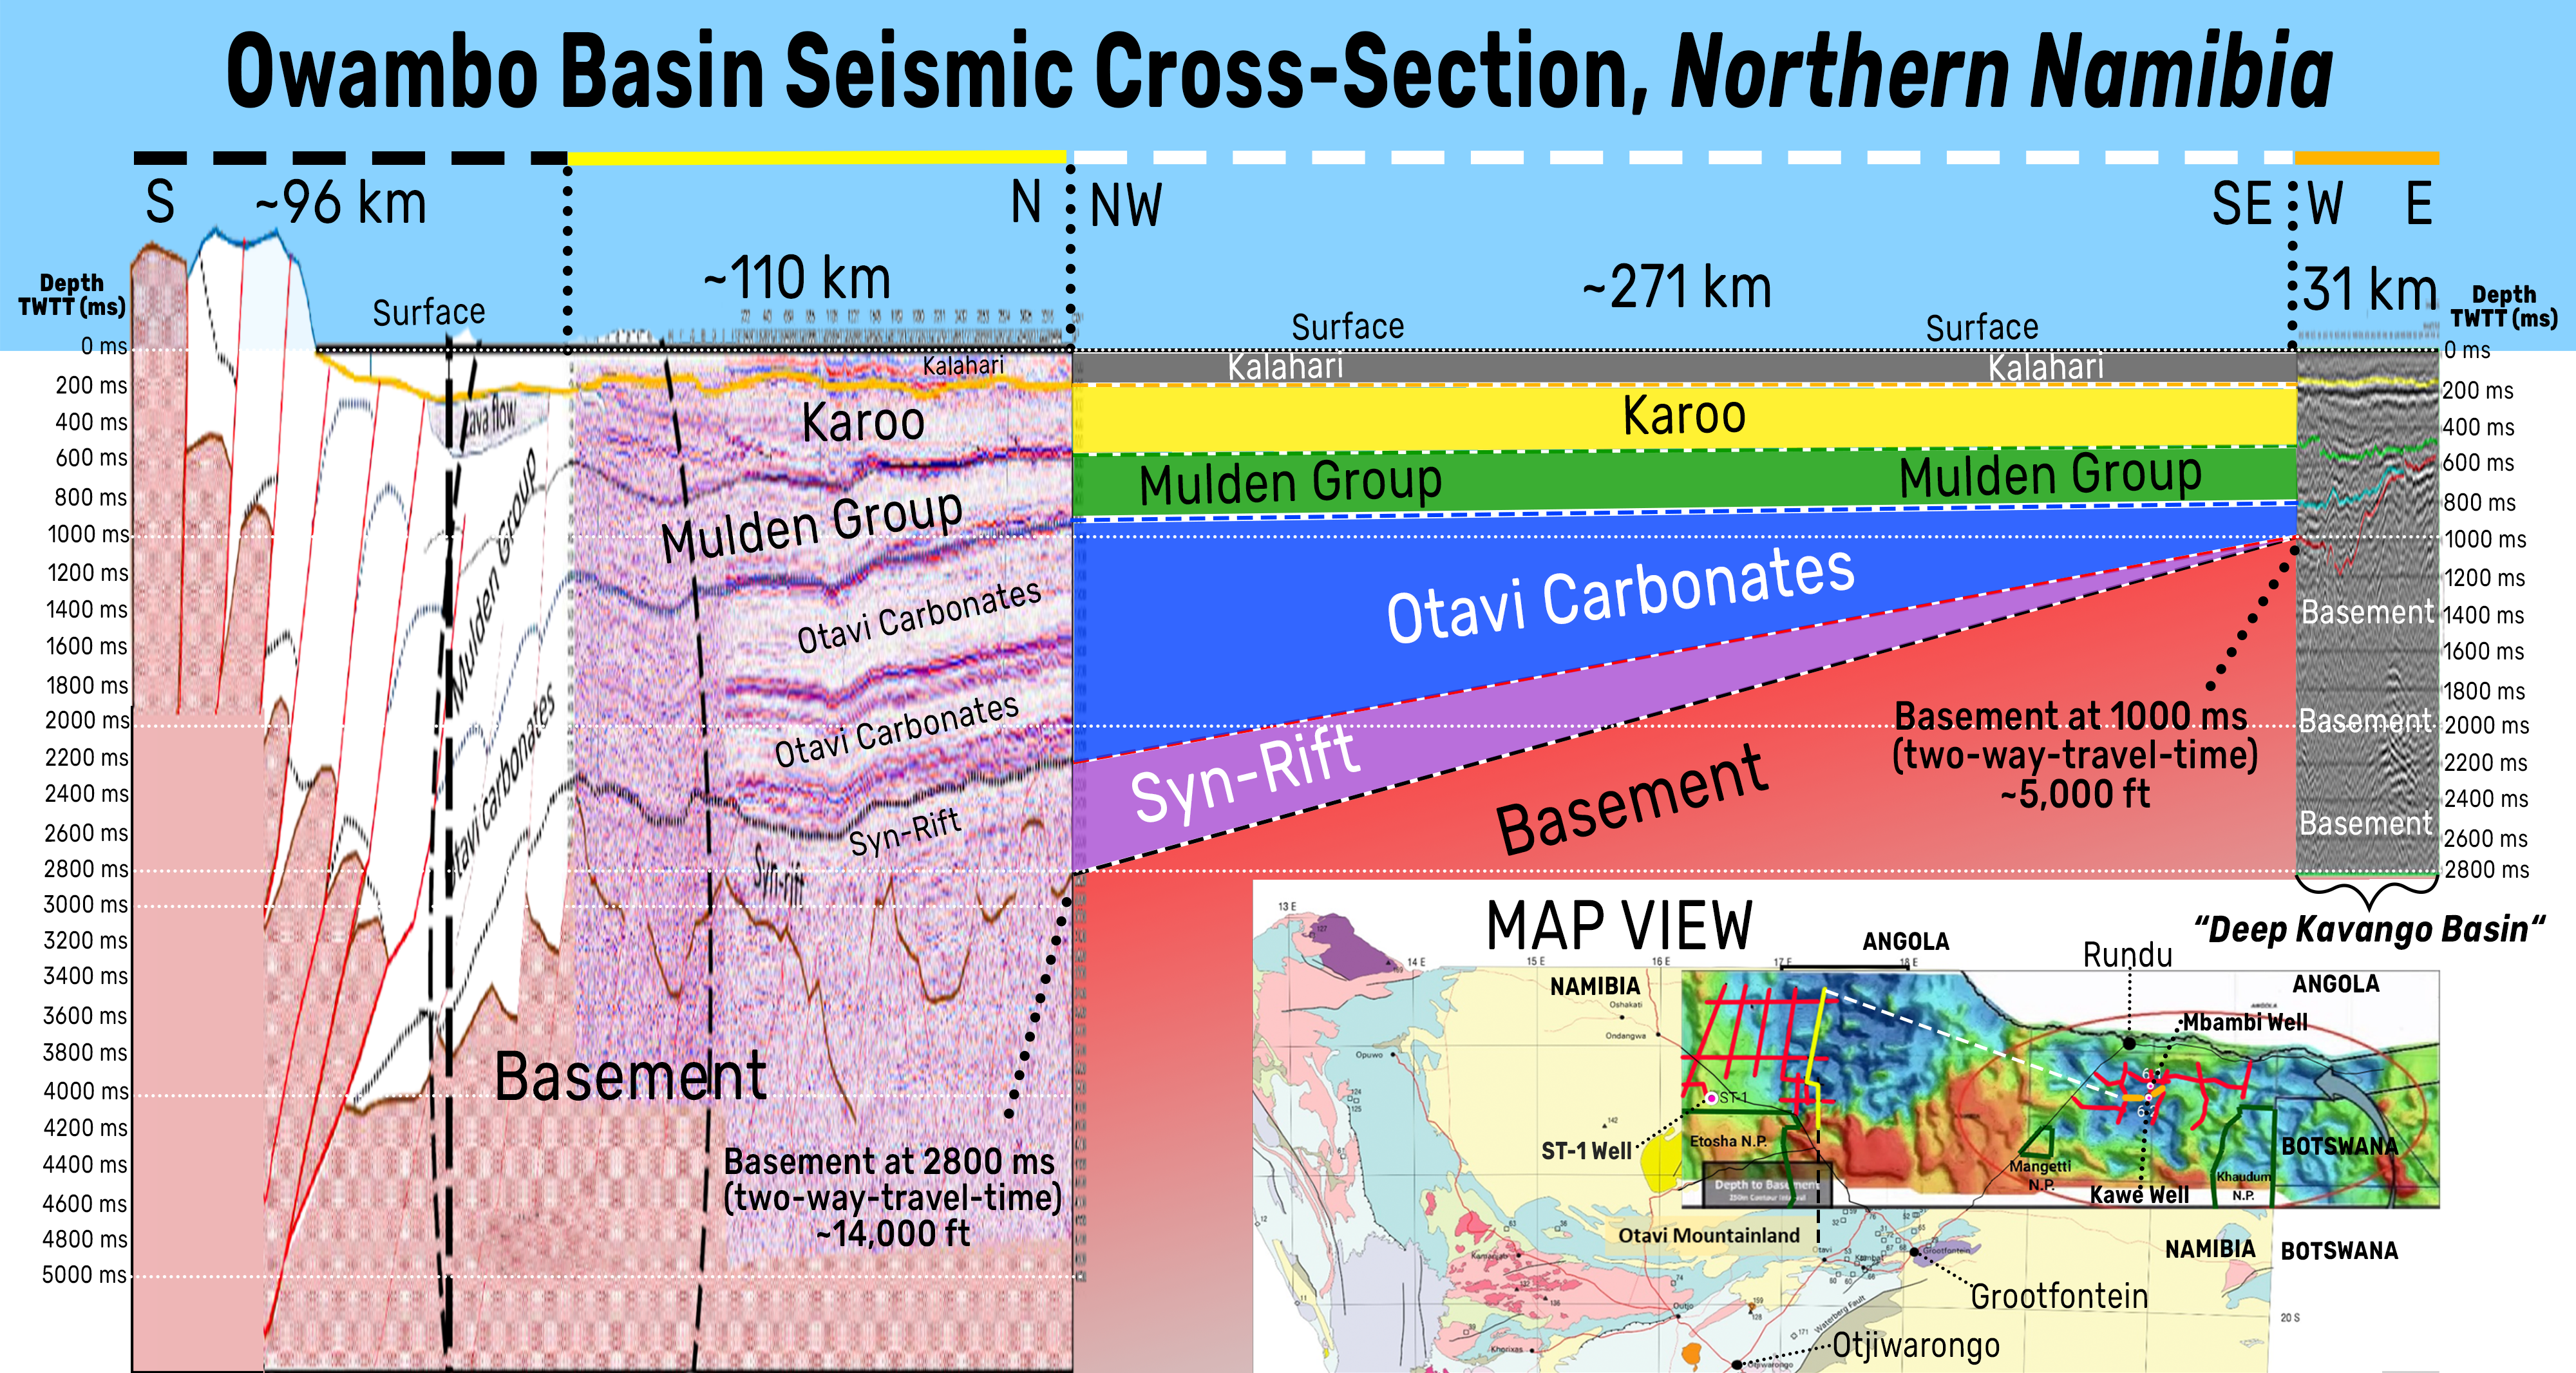
In between the two MEL blocks edged in red and the ReconAfrica blocks edged in grey are two blocks (edged in green) leased to ACREP, an Angolan Petroleum services company. ACREP completed its environmental assessment in 2017 and “started it survey of the Owambo/Etosha basin”. ACREP did a seismic survey in 2018 in their block (no 1818) according to ReconAfrica’s EAR (Risk Based Solutions 2020). Jim Granath shows this seismic line in his talk to the Houston Geological Society on October 21. It is reproduced on a small scale and it’s difficult to read, but the Otavi Group occurs at the same depth as in Matt Totten’s correlated section in Figure 10 and also at the same depth as ReconAfrica’s well shown below: at ca. 1,200 m depth. This is NOT a ‘deep basin’.
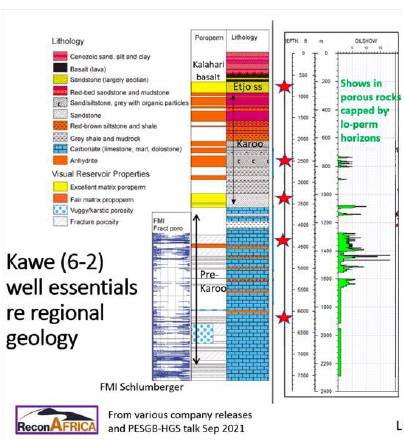
Above is the lithology of the 6-2 well as described by Ansgar Wanke. Dr. Ansgar Wanke is a German geologist who completed his PhD in 2000 at the University of Wurzburg on the tectonics of NW Namibia. From 2008 to 2019 he was a professor at the University of Namibia, after which he left to join ReconAfrica. I trust that he’s able to describe the lithology (the rocks) in the well accurately, i.e. I assume this is a correct representation of the sequence of rocks present below the surface in the Kavango area. So here we go: the Otavi Group Carbonates are encountered at about 1,200 m depth. This is a shallow basin with pathetic oil shows. When asked about the lithology of this well during the talk to the Houston Geological Society, Jim Granath says he “can’t answer” whether the lower Karoo was present and whether this interval is thick enough to generate an oil window. He also mentions they don’t know whether the prominent Mulden marker is present. Believe me, you wouldn’t miss that marker even on a lousy seismic line.
In his talk to the Houston Geological Society in November 2021, Jim Granath also mentioned that he had been in the field with Ansgar Wanke in NW Namibia. Together they came up with a complicated tectonic model that supposedly explains how the much older Rifts in NW Namibia extend into the subsurface in NE Namibia, leading to a very deep basin with lots of mature hydrocarbons. Jim Granath reported that they have submitted an article discussing this model to a special issue of the Journal of Structural Geology. This article came out in late June 2022 and I include a comment in the next paragraph.
I have studied both Granath’s online presentations (Fall 2021) and I can’t make head or tail of his tectonic model. I read a number of related scientific articles and there isn’t a single one that suggests at a hint of a possibility for his proposed model. There is no evidence of (Permian) Karoo-age rifting, but there is evidence of later (Jurassic) rifting (for example Modisi et al., 2000). Of course, someone will tell me that scientists always come up with completely new ideas and this is true. But those new ideas always have a basis in the scientific literature, sometimes in a parallel domain of science. Granath’s model seems to have no basis in the scientific literature and the graben structures that he postulates must be present below the surface in the Kavango area, are not observed on the available seismic data.
The long-awaited article by Granath et al (2022) may be a contribution to the geologic origin of the Waterberg Thrust, but it doesn’t provide any documented geologic evidence that underpins the hydrocarbon exploration program by Recon Africa in the Kavango area: the few off-hand references to the Kavango area serve only to whitewash the shoddy geologic underpinning of the Kavango hydrocarbon exploration venture. I include a longer comment on this article at the end
In this talk, Jim Granath also mentions “reef-prone lower Paleozoic units”. What?? The Otavi Group limestones are late Proterozoic, not Paleozoic and there is no evidence of any lower Paleozoic limestone units in ReconAfrica’s well, nor in any other literature. In answering the questions from the audience (it’s a zoom talk) he mostly waffles about what they’re encountering
There’s more that’s suspicious about Jim Granath’s activities here. In his talk to the Houston Geological Society he mentions that Craig Steinke came ‘sniffing for plays’ in about 2014 and “hinted he could get investment”. Jim Granath had never worked in southwestern Africa, but in 2018 he published an article arguing for producing both conventional and unconventional hydrocarbons in Sub-Saharan Africa. This article is not peer-reviewed, i.e. nobody has vetted the ideas he launched in it. Then in 2019 ReconAfrica starts its activities. I smell unethical practice here.
In their other literature, ReconAfrica also makes a big deal of how the Permian of the Karoo Group compares well, as an oil system, to the prolific Permian Basin of West Texas. The West Texas Permian Basin contains almost exclusively carbonates (limestones) and the area at the time was just north of the equator on the western margin of the supercontinent (see figure 4). Paleolatitude and thus climate and thus conditions for carbonate deposition in what would become West Texas were incomparable to those of NE Namibia at the time. But ReconAfrica also said they’re targeting the Whitehill and Prince Albert Formations, which are shales (i.e. not carbonates). These shales haven’t been encountered in the well and earlier literature (Catuneanu et al., 2005) didn’t show there was a basin there at all. Hence the Karoo-age sandstones in the well substantiate what existing literature demonstrated (there’s no basin, there are no shales, there was no “lake”). ReconAfrica also states something about favourable conditions of these shales (there are no shales!) in comparison with e.g. the “Bakken and Woodbine Formations”. The Bakken Formations are part of the Bakken Shale basin in the US Dakotas and the Woodbine Formation is a shale interval in the Gulf of Mexico subsurface in Texas. Both of these formations are tight shales, i.e. unconventional reservoirs and fracking has been used to produce oil from both (see Matt Totten Jr.’s talk about more on this topic).
Producing hydrocarbons from shales (the Whitehill and Prince Albert Formations) would require fracking. ReconAfrica doesn’t have a permit for fracking and Namibia says it doesn’t allow it. ReconAfrica had its potential resources evaluated by an independent resource evaluator, the Sproule company. The Sproule report (2020), based entirely on literature, public data, and probabilistic methods, also states that these Formations are tight (i.e. would require fracking). But seismic and well data don’t show that the Whitehill and Albert Formations occur here, which is in line with existing literature.
Note that the founder of ReconAfrica, mr Craig Steinke and one of the senior geologists, mr Nick Steinsberger both made a name in unconventional (tight, fracked) hydrocarbon production. And Jim Granath himself wrote at least two papers building the case for unconventional hydrocarbon development in Southern Africa.
No oil of any significance has ever been found in rocks (sandstones, shales) of the Permian Karoo Group further east in Botswana. One of the reasons for this absence of hydrocarbons may be explained by the presence of the Okavango Dyke Swarm (Le Galla et al., 2005). The Okavango Dyke Swarm is about 180 million years old. Its immense heat may have cooked the hydrocarbon rocks to the point that they got evaporated out of the rocks (‘devolatized’).
Conclusion
Viceroy Research (2021) blasted ReconAfrica’s enterprise for deceiving (potential) investors and from not being clear about whether they will need to use fracking. This claim is also made in the lawsuit that was filed against the company.
At this point in time (late November 2021) we are sure a deep Kavango Basin doesn’t exist. We also have seen that the oil shows in the 6-2 well are pathetic. Did ReconAfrica know this all along? Did Jim Granath invent his tectonic model to pump the stock and get a nice cash reward himself?
Aside from this, I imagine the company, staffed with fracking experts, knew all along that fracking is illegal in Namibia, but maybe they thought they could twist a few arms in what is a country with high levels of corruption (see for example here and here). Fracking in this part of the world would be completely and utterly irresponsible given its high water demand in this bonedry savannah area where local people depend on clean water.
The Namibian government wants to attract oil and gas development, arguably as “a bridge to net zero in 2050”. Namibia has all of 2.5 million inhabitants and is mostly desert. With the right public investment policies, the country can develop its required electricity infrastructure without having to resort to Oil and Gas development. The world is in a climate crisis and must transition to non-carbon energy as fast as possible. We all know that we can’t do that overnight. Producing existing plays during this “bridge period” is legit, but developing new plays in pristine parts of the world is disingenuous and inexcusable.
References
Prince Harry, Duke of Sussex and Reinhold Mangundu, October 14, 2021, Protect the Okavango River Basin from corporate drilling. Washington Post
Africa Good Morning, 16 July 2021, Geologist Matthew Totten on ReconAfrica
Baxter, J., October 8, 2021. A Calgary Company is drilling for oil in the world’s largest international wildlife reserves. These Nova Scotians are trying to stop it. Halifax Examiner
Catuneanu, O, H. Wopfner, P.G. Eriksson, B. Cairncross, B.S. Rubidge, R.M.H. Smith, P.J. Hancox, 2005, The Karoo basins of south-central Africa. Journal of African Earth Sciences 43, p. 211–253
Clauer, N. and A. Kroner, 1979, Strontium and Argon isotopic homogenization of pelitic sediments during low-grade regional metamorphism: the Pan-African Upper Damara sequence of northern Namibia (SW Africa). Earth and Planetary Science Letters, v. 43, p. 117-141
Corner, B., Crustal framework of Namibia derived from Gravity and Aeromagnetic data
Granath, J.W. and William Dickson, 2018, Organization of African Intra-Plate Tectonics.*Search and Discovery Article #30555, Posted March 12, 2018 . *Adapted from extended abstract prepared in conjunction with oral presentation given at AAPG/SEG 2017 International Conference and Exhibition, London, England, October 15-18, 2017.
Granath, J.W. and William Dickson2, 2018, Why not both conventional and unconventional exploration in Sub-Saharan Africa? Search and Discovery Article #30551 Posted February 19, 2018. *Adapted from oral presentation given at AAPG 2017 Annual Convention and Exhibition, Houston, Texas, United States, April 2-5, 2017
Granath., J.W., A. Wanke and H. Stollhofen, 2022, Syn-kinematic inversion in an intracontinental extensional field? A structural analysis of the Waterberg Thrust, northern Namibia. Journal of Structural Geology, v. 61
Haddon, I.G., 2005, The Sub-Kalahari Geology and tectonic evolution of the Kalahari Basin, southern Africa. Unpublished PhD thesis, University of Witwatersrand, Johannesburg, South Africa, 360 p.
Hoak, T.E., A. L. Klawitter, C.F. Dommers and P.V. Scaturro, 2014, Integrated exploration of the Owambo Basin, onshore Namibia: hydrocarbon exploration and implications for a modern frontier basin. Search and Discovery Article #10609, Adopted from poster presentation given at 2014 AAPG Annual Convention and Exhibition, Houston, Texas, April 6-9, 2014
Le Galla, B, Gomotsang Tshoso, Jérôme Dyment, Ali Basira Kampunzu, Fred Jourdan, Gilbert Féraud, Hervé Bertrand, Charly Aubourg, William Vétel, 2005, The Okavango giant mafic dyke swarm (NE Botswana): its structural significance within the Karoo Large Igneous Province. Journal of Structural Geology, v. 27, p. 2234-2255.
Modisi, M.P. , Atekwana, E.A., Kampunzu, A.B., Ngwisanyi, T.H., 2000, Rift kinematics during the incipient stages of continental extension: evidence from the nascent Okavango rift basin, northwest Botswana. Geology, v. 28, no. 10, 939-942.
National Geographic Articles: October 28, 2020; October 29, 2020; January 28, 2021; March 12, 2021; May 11, 2021; May 21, 2021; June 25, 2021;
ReconAfrica News Release 1 and 2
Reeves, C.V., 1979, The reconnaissance aeromagnetic survey of Botswana – II: its contribution to the geology of the Kalahari. In: McEwan, G. (Ed) The proceedings of a seminar on geophysics and the exploration of the Kalahari. Geological Survey of Botswana Bulletin, v. 22, p. 67-92.
Risk Based Solutions (RBS), 2021, Draft environmental scoping report, Report to support the application for Environmental Clearance Certificate (ECC) for the proposed 2D seismic survey covering the area of interest (AOI) in Petroleum Exploration License (PEL) no 73, Kavango Basin, Kavango West and East regions, northern Namibia, 134 p.
“Sproule Report”: Kovaltchouk, A., Suryanarayana Karri, Cameron P. Six, 2020, Estimation of the prospective resources of Reconnaissance Energy Africa Ltd in Botswana and Namibia (as of June 30, 2020) for the purpose of assessing the potential hydrocarbon resources of the Company’s interests in Botswana and Namibia.
Totten Jr., M., November 16, 2021. “Oil in the Kavango? ALL risk NO reward for Namibia”. Talk presented to the Namibia Scientific Society. The video is here
Viceroy Research Group, 24 June 2021, Recon Africa – no oil? Pump stock; 29 June 2021 ReconAfrica – Con Africa; 30 June 2021, ReconAfrica – Interview w Maggy Shino; 13 July 2021, Africa Good Morning Interview with geologist Jan Arkert; 14 July 2021, Recon Africa – polarization and disengagement. 21 July 2021, ReconAfrica – unpromotional services; 7 September 2021, Another Swing Another Miss
Wanke, A., 2000, Karoo-Etendeka unconformities in NW Namibia and their tectonic implications. PhD Dissertation, University of Wurzburg, 116 pages plus figures.
Wanke, A., H. Stollhofen, I.G. Stanistreet, and V. Lorenz, 2001, Karoo-Etendeka unconformities in NW Namibia and their tectonic implications. Communications Geological Survey of Namibia no. 12, p. 291-301
Werner, M., 2006, The stratigraphy, sedimentology and age of the late Paleozoic Mesosaurus inland sea, SW Gondwana; new implications from studies on sediments and altered pyroclastic layers of the Dwyka and Ecca Group (lower Karoo Supergroup) in southern Namibia. PhD dissertation, Univ. of Wurzburg, 428 p.
York, G. Globe and Mail articles from 2020 an 2021 are linked above in the introduction
EARLIER UPDATES
Update: October 28, 2021
The Botswana Newspaper “Sunday Standard” reports that Recon Africa has been sued in the US for scamming investors. Read the story here. It’s a class action suit submitted by The Klein Law Firm and filed in the US District Court for the Eastern District of New York. Recon Africa reports that one Eric Muller has filed the suit – the company states it will undertake vigorous action to defend itself.
The lawsuit contains 10 claims. Two of the claims pertain to issues that I discussed in this blog post. I support both of these claims: claim no. 1 alleges that ReconAfrica planned to use unconventional means for energy extraction (including fracking) in the fragile Kavango area. Claim no. 8 alleges that ReconAfrica’s interests are in the Owambo Basin, not in the so-called Kavango Basin.
Update: October 20, 2021
On October 14, Prince Harry, the Duke of Sussex, and Namibian Environmental Activist Reinhold Mangundu published an opinion piece in the Washington Post entitled “Protect the Okavango Basin from corporate drilling”
Update: October 10, 2021
On October 8, the Halifax Examiner’s investigative reporter Joan Baxter published an article on ReconAfrica. Full disclosure: I’m quoted. But the article covers a lot more ground than what I could cover here and puts pressure on the Canadian Ombudsperson for Responsible Enterprise to investigate the shady practices of this Canadian company.
Updated September 28, 2021
South African Environmental Law Firm Schindler’s Ecoforensics wrote a letter to Canadian Prime Minister Justin Trudeau on May 27 of this year. The letter stresses that Canadian company ReconAfrica acts in violation of international agreements that Canada is signatory to. Copies of the letter were sent to all political party leaders (mr Erin O’Toole, mr Jagmeet Singh and ms Annamie Paul), to ministers Wilkinson (Environment and Climate Change, now minister of Natural Resources) and O’Reagan (Natural Resources) as well as to Elizabeth May (Green Party). Sadly this letter got buried in every addressee’s file cabinet because Canadians haven’t heard anything about it.
Updated August 31, 2021
After 31 years of leaving the local population exposed to unexploded land mines, @ReconAfrica announced on August 31, 2021 that the Namibian police is aiding in land mine removal in the area.
Update August 19, 2021
On August 18, there was presentation to the media about this project in Windhoek, the capital of Namibia. Windhoek-based former petroleum geologist Matthew Totten Jr took the lead in debunking the claims by ReconAfrica. The presentation is here (Matthew Totten starts at minute 7).
Update August 6, 2022
My full comment on the article by Granath, Wanke and Stollhofen, see reference list for complete citation:
The single most important dataset used by Granath et al is the unpublished 2001 PhD dissertation by Wilfried Jooss (University of Würzburg, Germany). The article relies for most of its content on this dissertation. The authors did a bit of additional fieldwork. I find it at least unusual that Wilfried Jooss, about whom I can’t find anything online, is not included as an author. No scientific articles seem to have been published from this dissertation, so the main body of this article relies on untraceable literature (unless you’re willing to pay Amazon for a digital copy). In addition, the authors don’t thank any reviewers, which is highly unusual, to put it mildly.
There are some other unusual errors and omissions in this paper. Figure 1 lacks Lat/Long coordinates and contains an error: the green box doesn’t refer to Figure 2 but to Figure 3. In the caption of Figure 4, it says the white lines are the locations of cross sections depicted in Figures 4 and 5. No, that should have read Figures 5 and 6. A reviewer would have caught these errors.
In the introduction, the authors state: “the Waterberg basin is connected to the NE under Kalahari basin cover to the Kavango Basin through what we call the Omatako trough (Fig. 1)”. They cite the two not peer reviewed extended abstracts by Granath and Dickson (see reference list above) to support this statement. I’m sorry, this is forbidden in scientific practice: you can’t cite literature that hasn’t been peer-reviewed as evidence for something you can’t observe yourself. No Omatako trough is shown on Figure 1 either, but I assume it’s simply the NE-SW valley that the ephemeral Omatako River runs through, joining the Okavango River east of Rundu.
In Fig. 1 the authors draw a tiny dashed line (four dashes!) between the Waterberg area and the Kavango area without telling us what it means. In the text they claim that the features in the Waterberg thrust area are connected to the features further to the NE and reiterate their imaginary Southern Trans-African Rift and Shear System (STARSS) to imply a connection between the Waterberg thrust features and those documented in figure 5. Again: this is whitewashing the two not-peer-reviewed abstracts by Granath and Dickson and that’s forbidden in scientific practice. But by doing so, the authors are seemingly legitimizing the Recon Africa exploration activities (don’t forget that the second author of the article, Ansgar Wanke, who used to be a prof at the university in Windhoek, is now the geologist with Recon Africa).
There is more in this paper that doesn’t meet the requirements of good scientific practice. A paragraph on page 4 cites multiple examples of inversion tectonics elsewhere in the world as supporting evidence for inferred inversion tectonics here. I’m sorry, just because something may have happened in place A, doesn’t mean it happened in the same way in place B. This practice is like saying: “a cow has four legs, hence every 4-legged animal is a cow”. To cover their asses, they admit, on page 11“this prima facie evidence is obviously not present”. Just below this, they go in white-wash overdrive again, citing the hypothetical models proposed in the Granath and Dickson abstracts (again, not peer-reviewed) “in what has been called the Kavango Basin, a group of extensional graben in proprietary seismic data acquired by Reconnaissance Energy Africa”. Let me remind you that a scientific paper should not pass review when it quotes proprietary data that the reader can’t check! Again, was this paper even reviewed?
On page 8, the authors go into speculation overdrive: “Figure 4 postulates the possibility..” to end with “our analysis concludes that the Waterberg Thrust hanging wall and its deformed footwall region are elements of a footwall short cut system in front of the reactivated and inverted deeper growth fault represented by the as-yet-unproven red fault trace”. Excuse me? You spent an appropriate time in the field (we have no idea how much time they spent in the field) and you didn’t check this hypothetical fault trace which is only a few kilometers away from your fieldwork area?
This paper contribute some knowledge to the geologic origin of the enigmatic Waterberg Thrust (except I think the mysterious Wilfried Jooss is the only one who should get credit for the work), but it doesn’t provide any documented geologic evidence that underpins the hydrocarbon exploration program by Recon Africa in the Kavango area: the few off hand references to the Kavango area serve only to whitewash the shoddy geologic underpinning of the Kavango hydrocarbon exploration venture.
Do’s and Don’ts / Save Owl’s Head
Third essay for Nova Scotia Premier @IainTRankin and Minister of Environment and Climate Change @KeithIrvingNS on the issue of the government’s theft and illegal sale of Owl’s Head Provincial Park
—–
Many of us have watched “My Octopus Teacher”, a stunningly beautiful documentary of free diver and film maker Craig Foster and his encounters with a female octopus in the kelp forests off the eastern Cape of Good Hope in South Africa. The documentary was made as part of an effort to save and protect those kelp forests.

Last summer I visited the most beautiful place on earth. I won’t tell you where it is, except that it’s right here in Nova Scotia, somewhere along our eastern shore. I will also tell you that it’s part of an island and that I went there in a kayak.
Like so many of the hundreds of islands along this coast, this one is uninhabited. It looks unremarkable on a map, just a roundish blob of rock with a small polyp-shaped bay on one side, connected to the surrounding sea by a narrow entrance. We sneaked through it – no other boat but a kayak would fit through there really. All of a sudden the stiff and cool wind that we experienced over the sea fell away, the temperature rose and the water was flat. Everything became calm. No sound but the wind in the marsh grasses surrounding us in this enclosure that’s maybe 100 m across. Beneath our boats, a magical world unveiled itself. The bottom was no more than 3 feet away. Crinkly seaweed curled around our paddles, tiny fish and shell fish scuttled across the bottom, pink tentacles of unknown plants floated below and twisted itself around myriads of other vegetation. The diversity of life in this tiny water body is astonishing and astonishingly beautiful. Almost nobody comes here; occasional kayakers have no place to land so they float around for a bit and leave, being forever enriched by a truly pristine environment.
Such coastal shallow marine ecosystems are hugely important for us humans. Kelp forests and Eelgrass meadows (Zostera marine) baffle waves, thus allowing sediment to settle, which in itself allows the eelgrass meadows to expand. Eelgrass meadows are nurseries for more than 25% of the world’s largest fisheries including Cod and Lobster. In other words, they are essential for our food security.
Shallow marine environments have been degraded by human intervention to disastrous extents. Along the Northeastern shores of North America, about ¾ of all eelgrass is gone – as a result of degraded water quality, caused by pollution that causes eutrophication (oversupply of nutrients, leading to a decline in species diversity and a rise in opportunistic single species), overfishing, massive sedimentation and disease. But while Nova Scotia’s shores, especially our Eastern shore, are still relatively undeveloped, warming oceans also pose a threat to these ecosystems. Nova Scotia has lost more than 90% of its kelp forests as a result of ocean warming alone. About 17 years ago I marveled (from my kayak) at the the kelp forest of Boyd’s Cove near Kejimkujik National Park. Apparently, that kelp forest has disappeared.
In a recent paper in the prestigious scientific journal Science, nearly two dozen Canadian scientists argued the need for increased Natural Climate Solutions in Canada. Why? Because mitigation efforts currently being implemented under the “PanCanadian framework of clean growth and climate change” will not be sufficient to achieve Canada’s goals under the – legally binding! – Paris accord. Reminder: as part of the Paris agreement, signed in the Fall of 2015, Canada commits to a 30% reduction of Greenhouse gases (GHG) by 2030.
Such mitigation measures require huge investments. But what these authors are saying is that even those investments won’t be enough to reach the goals that we are legally committed to. So we must do more. And we can do more – in part simply by doing less.
Natural systems absorb Carbon from the atmosphere because plants photosynthesize by breathing in CO2 and storing it in their tissues. This is called Carbon sequestration. Some ecosystems absorb more Carbon than others. Wetlands store significant amounts of Carbon so if we protect wetlands, we enable and enhance Carbon storage in natural systems (if you want to know more about this subject, Google “Blue Carbon”). It’s really that simple: don’t convert or destroy wetlands, do restore and protect wetlands. The protection, management and restoration of natural systems benefits so many: soil productivity is enhanced, water and air become cleaner, biodiversity and – consequentially – food security improves.
Implementing Natural Climate Solutions essentially means we’ll adhere to the Precautionary Principle, which the Canadian Government subscribes to: “The government’s actions to protect the environment and health are guided by the precautionary principle, which states that “where there are threats of serious or irreversible damage, lack of full scientific certainty shall not be used as a reason for postponing cost-effective measures to prevent environmental degradation.”
Fish stocks are in decline everywhere in the world. Overfishing and destruction of critical habitats such as nursing and feeding grounds are to blame, together with pollution from industry and agriculture. Our planet is warming rapidly and every bit of natural carbon storage must be protected and enhanced.
The authors of this article estimate that if Canada got serious about implementing Natural Climate solutions, it can provide nearly 79 Terragrams CO2/year of mitigation potential in 2030. How much is that? That is equivalent to the 2018 emissions from all of Canada’s heavy industry. If Canada implemented additional Natural Climate Solutions, we could exceed our current agreed contributions, thus improving living conditions for generations after us.
Significant eelgrass meadows occur off Owl’s Head Provincial Park. This factor alone was part of the reason the Federal Government proposed the area for a Marine Protected Area (MPA). That designation hasn’t come through yet, but it would provide an opportunity to protect both a fragile coastal headland (Owl’s Head Provincial Park) and its adjacent shallow marine area. But… in 2019 Nova Scotia’s Land and Forestry minister Iain Rankin secretly sold Owl’s Head Provincial Park, designated 44 years ago, to a foreign billionaire who wants to develop it into a gated elitist golf resort. In order to create such an artificial environment, the headland would be blasted to bits and massive amounts of sediment would end up being dumped off the headland, killing the eelgrass meadows. In addition, the nearshore would be at huge risk of golf ball pollution.
The scientific evidence is clear: don’t do anything that risks damaging highly productive shallow marine environments because they provide us with Natural Climate Solutions and critical elements of food security which we badly need.
Undo the theft. Give us back Owl’s Head.
Literature
Drever, C.R., S.C. Cook-Patton, F. Akhter, P.H. Badious, G.L. Chmura, S.J. Davidson, R.L. Desjardins, A. Dyk, J.E. Fargione, M. Fellows, B. Filewod, M. Hessing-Lewis, S. Jayasundara, W.S. Keeton, T. Kroeger, T.J. Lark, E. Le, S.M. Leavitt, M-E LeClerc, T.C. Lemprière, J. Metsaranta, B. McConkey, E. Neilson, G.P. St-Laurent, D. Puric-Mladenovic, S Rodrigue, R.Y. Soolanayakanahally, S.A. Spawn, M. Strack, C. Smyth, N. Thevathasan, M. Voicu, C.A. Williams, P.B. Woodbury, D.E. Worth, Z. Xu, S. Yeo and W.A. Kurz, 2021, Natural climate solutions for Canada, Science Advances, v. 7, no 23, eabd6034. DOI: 10.1126/sciadv.abd6034
Hawkins, N, 2016, Nova Scotia’s Wild Islands. Canadian Geographic, Feb 19.
Reynolds, L.K., M. Waycott, K.J. McGlathery and R.J. Orth, 2016, Ecosystem services returned through eelgrass restoration. Restoration ecology, v. 24, no. 5, p. 583-588. https://doi.org/10.1111/rec.12360
Chiasson, M.D., 2020, Meet the super-plant from Nova Scotia’s shorelines: Eelgrass. The Coast, Feb 27.
Posted in Owl's Head
Leave a comment
The rape of our lands / Save Owl’s Head
Second essay for Nova Scotia Premier @IainTRankin and Minister of Environment and Climate Change @KeithIrvingNS on the issue of the government’s theft and illegal sale of Owl’s Head Provincial Park
I was stunned when Robert Devet asked me to republish this essay in the Nova Scotia Advocate, where it appeared on May 14, 2021. Sadly, Robert passed away suddenly on October 4. I salute him, may he rest in power.

This is a myth
When the city of Rome was founded, its founder Romulus advertised the settlement as a safe haven for anyone who wanted to start a new life. In a short time, the new town, soon the iconic eternal city on seven hills became a destination for large numbers of people: refugees and criminals and former slaves – mostly men.
Romulus realized that the city needed an influx of women, so it could grow its own population. How to go about it? The Sabine people, who lived nearby, had refused to let their daughters marry the unruly and thuggish Romans. So Romulus organized games and invited the Sabines to come and watch. Imagine, free tickets for a top sports event! And so the Sabines came, with their wives and daughters. When everyone had arrived at the big event, Romulus gave the sign and his armed men captured the Sabine families, separated the women and let the men go. Thirty-one women were thus kidnapped, all but one of them virgins (young daughters). The Sabine men returned to their lands and vowed to get their daughters back. It took a year or so before they managed to return, but when they arrived they found the women unwilling to rejoin them as most of them had children now and didn’t want to leave them. The one woman who had been married before to a Sabine man and was now married to Romulus himself managed to broker peace between the Romans and the Sabines, and so war was avoided and the city prospered for another 1000 years.
The prosperity came at the expense of 30 young women who were kidnapped, raped and forcibly subjected to Roman rule. They had no choice to concede to their fate after having born the Romans’ children.
The story of the Sabine virgins is a myth, but the practice of kidnapping and raping women during war have been all too familiar throughout human history to the present day.
But myths also serve as metaphors.
This is not a myth
About 400 years ago, North America began to be colonized by Europeans. The first Europeans were welcomed by the Indigenous people, but soon the colonizers turned on them and used every aggressive tactic under the sun to subject the Indigenous people to the rules of their Empire. They deliberately infected them with diseases for which they had no immunity, they stole their children, they killed them. In contrast to Indigenous practice, the colonizers raped and pillaged the lands for timber, whales, fish and mineral resources. And thus they built immense wealth for themselves, while the lands deteriorated and the Indigenous people were forced to abandon their semi-nomadic lives that were in balance with the land.
Western (colonizing) culture doesn’t perceive ‘nature’ as something that has rights or claim to consideration. In western culture, ‘nature’ is conceived as a set of ‘Natural Resources’ that exists for human use only. Mankind is perceived as ‘the crown of creation’, superior to ‘nature’. Having exhausted the natural resources of their homelands, the colonizers set out to find new lands and, when they found them, continued to exploit those lands in the same manner as in the Old World, a manner that is indifferent to Nature as having intrinsic value or rights or as an entity that serves us better in the long term if we use it in such a way that future generations can benefit too.
This is a male-dominated attitude of rape and pillage, enhanced by a religion-driven notion of human superiority.
Time and time again, the colonizers made huge mistakes. The endless forests of timber were cut down within 200 years, leaving just sticks. The breeding grounds for all that plentiful wildlife are gone. North America’s migratory bird populations have plummeted by one-third in the last 50 years alone. Not a single human generation grows up knowing what nature was like when their parents were young, that’s how fast the collapse is happening. The heroic efforts of individual conservationists to bring back a few iconic species (Bald Eagles, Buffalo, Whooping Cranes) are band aids that are too small for the huge wounds that are torn into the skin of the earth.
We sprayed DDT in the ‘50s and ‘60s and brought many species to the brink of extinction and had Rachel Carson not written ‘Silent Spring’, there would be no bald eagles over our heads in Nova Scotia, nor Herons and Kingfishers and countless other species. DDT was banned, but we are likely doing similar damage with Glyphosate and Neonicotinoids, yet those toxins are still not banned. Only in the last decade have scientists learned that a forest isn’t just a collection of haphazard trees. A forest is one gigantic ecosystem where the different parts – trees, shrubs, grasses, fungi – communicate with each other through chemical signals, thus enabling each other to be protected from invasive species and disease, but not from human predators. See the work of now world famous British Columbian scientist Dr Suzanne Simard
The colonizers became settlers and the lands in North America became new countries, maps and boundaries laid over unceded Indigenous territories. Forests and fish and minerals were monetized and this will continue until there’s only production forest left: long rows of a single species of trees forming a biologically dead carpet of green on disintegrating soil, the streams running between it barren of fish, which can’t thrive in such an environment. The only “edible” fish will be harvested from fish pens, their waste forming thick mats of oxygen-deprived black sludge on the sea floor. Ecosystems are diverse by nature, but diversity can’t be monetized and thus the colonizers are repurposing nature into monoculture.
In Nova Scotia we have reached a colonization super-state: the companies that deplete our resources for money are no longer ours, they are foreign.
- Northern Pulp (which Nova Scotia tax payers consistently subsidized for 50% of its annual costs) is owned by an Indonesian billionaire (yes, I know it closed, but I also know it’s still trying to reopen).
- The railroad behind my house, the original Dominion Atlantic railway, was privatized by the Provincial government nearly 30 years ago and sold lock, stock and barrel to an American who – of course – couldn’t maintain the infrastructure. The last train rode in 2006 and now we have to negotiate with this one foreign real estate owner for each piece of that unused rail bed that we want to repurpose. Most of the railbed has been converted to an active transportation trail, and Nova Scotia tax payers pay for the lease of this ribbon of real estate to the American owner (it should be expropriated of course, but who will take that bull by the horns?)
- Atlantic Gold, the company that exploits the Touquoy gold mine and wants to exploit three other gold mines along the eastern shore, got bought up by an Australian company (and hasn’t paid a penny in tax).
- About 10 years ago we managed to prevent an American company from opening a giant quarry on the Bay of Fundy, designed to export basalt to New England for the road and construction industry. We escaped major siltation and habitat destruction in the Bay of Fundy by the hair on our teeth.
- The Fundy Gypsum mine in Windsor was owned by an American company and it pulled out when the construction industry tanked after the 2008 depression.
- And, last but not least, Kitty and Beckwith Gilbert, an American billionaire couple, seduced (or blackmailed?) our Provincial government, specifically our then minister of Lands & Forestry, now our Premier Iain Rankin, into selling our land, the land of all nearly one million Nova Scotians in order to transform it into a gated luxury golf course. Not just any land, but land that we all thought was protected. Owl’s Head was designated as a Provincial Park. And because the minister knew that it was protected, he sold it behind our back. Now we, the citizens who owned this land and wanted to protect it in perpetuity because it comprises rare and unique ecology, are spending time and money to try to get it back, to prevent its destruction, to prevent it from getting blasted and crumbled and crushed and turned into something synthetic.
It’s colonization on steroids. It’s primitive. The one-time settlers together with the Indigenous people are now colonized by foreigners and made dependent on them. Nova Scotians are led to believe that they will be better off even though there’s no evidence this is or will be the case. The land is raped and lies desolate, foreign investors leave because their hot air balloons deflate. They couldn’t care less about the land or the long term future for the people who live here.
Private profit never serves the public interest. All this is rape. It’s the Sabine women all over. Our lands are raped, our future sold. The countless endangered birds, plants and sea creatures don’t speak our language and can’t defend themselves. There will be devastatingly Silent Springs across our lands.
Undo the theft. Give us back Owl’s Head
Posted in coastal systems, Geoheritage, Nova Scotia, Owl's Head
1 Comment
Undo the theft. Give us back Owl’s Head
Updated October 13, 2021
I sent this Open Letter to premier Iain Rankin and my MLA Keith Irving on March 22, 2021. I will be demonstrating in front of the law courts on April 1 in defense of Owl’s Head.
—–
I moved to Nova Scotia in 2002, having summered here for 5 years before that. I had fallen like the proverbial ripe apple out of the tree for this stunning part of the world. It took a few years to realize that what I perceived as nature here was for the most part a landscape that had been aggressively emptied of its natural resources, be they fish, forest, or earth resources. It was almost as if the Nova Scotia authorities still lived in that 19th century mindset that everything in the New World was limitless and up for grabs.
The theft of Owl’s Head came out of left field. I have visited the Eastern Shore extensively. I have friends there. I have kayaked its shores and walked its coastline. It’s a pretty empty part of our already empty Province. But the land grabbers thought that too and manipulated our authorities in giving it away. This act of betrayal prompted the letter below. I’m not the only one who is upset – fortunately. We hope we can turn the tide.

Undo the Theft. Give us back Owl’s Head
Open letter to Nova Scotia Premier Iain Rankin premier@novascotia.ca (@IainTRankin) and Kings South MLA and Nova Scotia minister of Environment and Climate Change Keith Irving keith@irvingmla.ca (@KeithIrvingNS)
Canada has only just begun to reconcile with the First Nations who lived in these lands long before us. We robbed them from their livelihood and resources for our own exclusive benefits. We clear cut forests, poisoned the water and locked First Nations people away in residential schools and on reserves. First Nations people first and foremost teach us to respect the earth so it can benefit the generations after us.
Nearly two years ago CBC journalist Michael Gorman discovered that Owl’s Head was taken off the list of to-be-protected Provincial sites so it could be sold for a pittance to a foreign billionaire. No public consultation, no media release, nothing: a deliberate attempt at total secrecy, a betrayal of democracy. Of course this was illegal and I assume the judge will agree on April 1 (update: the judge had to dismiss the case because “there is no recognized common law duty of procedural fairness owed by the Crown to the public at large”. This just means that our laws are weak and must be adjusted)
There are about 150 sites in Nova Scotia listed for eventual protection. As I write this, twelve sites are up for approval and the public is invited to comment. Researching these areas on the government website (update: this link is no longer functional) is very educational because it demonstrates how incredibly fragmented our land designations are. How odd, in such a thinly populated part of the world. How odd that 70% of the land in this thinly populated province, is privately owned. Truly, it’s the world upside down.
Nova Scotia protects 13% of its land, a bit more than 7,000 km2. Many countries pledge to protect about the same proportion of their land surface, but surely that’s a strange idea? Let’s compare Nova Scotia with Ireland and Denmark, two countries with which we have a few things in common: we’re all north Atlantic jurisdictions surrounded by salt water where fishing is big and where tourists flock, be it for a limited time in the year because of our otherwise hostile climate (ever heard of anyone going to Ireland or Denmark in winter? Me neither).
| Nova Scotia | Ireland | Denmark | |
| Area in km2 | 55,284 | 84,421 | 42,933 |
| Population | 979,000 | 4,900,000 | 6,000,000 |
| Population density (humans/ km2) | 18 | 58 | 140 |
| % / total area protected | 13% / 7,187 km2 | 14.4% / 12,157 km2 | 14.5% /6,225 km2 |
Nova Scotia’s population density is roughly 1/3d of that of Ireland and only 1/8th of that of Denmark. These countries have more population pressure than Nova Scotia, yet manage to protect the same percentage of land as Nova Scotia aims to do. Surely a jurisdiction with so few people as ours can protect more? Why should we only protect 13%? Why not a 25% (the goal of our Federal Government) or even half? Imagine, setting aside half of our land for protection. Our population density in non-protected areas would double, but it would still only be ¼ of that of Denmark or 2/3 of that of Ireland. And, imagine, we would have the other half of our glorious, amazing, beautiful Province protected. We would allow forests to re-grow, to be sustainably harvested (small-scale only), fish and moose to return and we would be able to marvel at it and be a role model for the rest of the world who would come to learn from us. Imagine the spin-offs.
Is this a weird idea? The world has lost half of its wilderness since I was born not quite 70 years ago. The rapid decline of biodiversity and coupled terrifying rate of extinction isn’t escaping anyone’s attention. In order for humanity to have a chance at a future, it needs biodiversity. The organization “Nature Needs Half” states: “setting aside 50% of the planet for nature is the fastest, most efficient action we can take towards solving the twin crises of climate change and extinction and protect the livelihoods of all people”. Surely Nova Scotia is in an excellent position to be a trailblazing world leader in this effort.
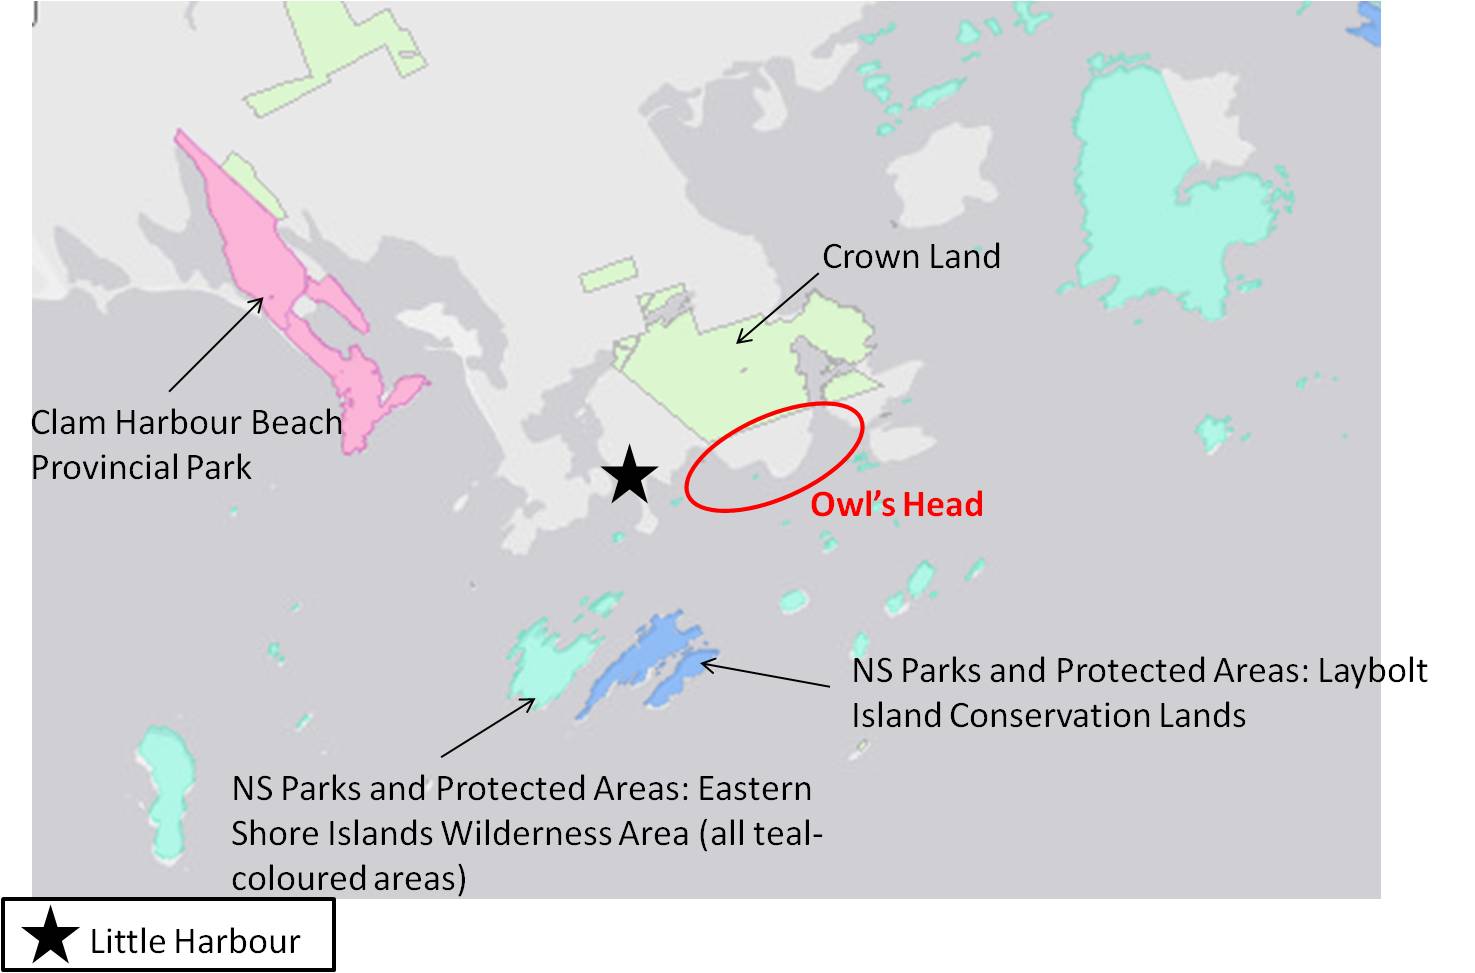
Mr and mrs Gilbert, an American billionaire couple who sentimentally claim that Owl’s Head is the most beautiful place on earth, have quietly been buying up properties in the area for two decades. This is not a wealthy part of Nova Scotia. I imagine the median income of permanent residents here is about $40,000. There aren’t many jobs and people have been forced to leave. This is tragic, and it happens all over rural Nova Scotia. Along our South shore, neo-colonizers have been pushing out locals on a large scale, jacking up real estate price and property taxes to levels that locals can’t afford anymore. Just look up Strum, Spectacle and Kaulbach Island for examples of pure obscenity. Shouldn’t Nova Scotians be able to live and recreate affordably in their own Province?
If the Gilberts truly believe that the Owl’s Head area is the most beautiful place on earth, then why didn’t they donate the lands they purchased to the Nova Scotia Nature Trust, guaranteeing preservation in perpetuity? Doing so would have encouraged the Province to fast-track the definitive protection of Owl’s Head. That would have been the logical thing to do. My late Wolfville neighbour Jack Herbin made the first donation to the Nova Scotia Nature Trust back in 1995 by gifting them the Brothers’ Islands in Minas Basin. Wolfville friends of mine donated their South Shore Island to the Nova Scotia Nature Trust in 2010, around the same time that Farley and Claire Mowat donated their 200 acres near River Bourgeois on Cape Breton to the Nova Scotia Nature Trust. Said Farley Mowat: “Nova Scotia is like every other part of the western world, teetering on the edge of falling into some developer’s hands and being destroyed for money”.
The Gilberts are foreign billionaires who have managed to acquire power over the future of a handful of citizens of our Eastern shore, only to benefit themselves. Many in the community believe that there will be jobs from the proposed golf course development. I doubt that this will ever be the case, but even if it does, the result of their efforts will be that the locals become dependent on foreign patrons. They will basically be forced into all but indentured labour as they will have no other job options.
Instead imagine that Owl’s Head was a Provincial Park. Imagine how many local cafes, restaurants, B&Bs and shops would spring up! As well as kayak rental, guided fishing trips etc. Businesses that people own themselves, not as dependents from some foreign patronizing billionaire who slowly emptied the lands of its residents. There’s no question that the Gilberts just want to get richer because why otherwise would they want to destroy nature? The physiography of Owl’s Head, consisting of steeply tilting sandstones alternating with slightly softer slates, results in a tight and rugged relief of several meters of hard rock with a unique small-scale biodiversity. This relief is not conducive to golf course construction at all. The headland will have to get blasted to smithereens and the sandstone crushed to make for golf bunkers and softly rolling relief. Gone will be the shore birds, the kelp forests, the Ospreys and all other fragile coastal habitat. “Selfish activity within the group provides competitive advantage but is commonly destructive to the group as a whole” writes world renowned Harvard ecologist and evolutionary biologist E.O. Wilson.
In analogy with E.O. Wilson’s observation, our history of land abuse provided a short-lasting competitive advantage for the colonizers, but has now become destructive to us as a society. Allowing fragile public lands to be owned by foreign land grabbers, who will turn it into a sterile resort, accessible only to an exclusive elite for a limited time of year, perpetuates and reinforces colonial culture. Also this is a wet, cool, foggy coast and I know for sure that golfers don’t like that kind of weather, as confirmed by avid golfer and Nova Scotia lawyer Dale Dunlop here
Real political leadership means providing what all people need, not what some people want. The community of Little Harbour doesn’t need low wage seasonal jobs from a foreign enterprise that will cater only to other (foreign) billionaires. All Nova Scotians need more public spaces, more wilderness, more parks, more trails, more publicly accessible coastline and more opportunities to create their own livelihoods and be in charge of their own resources and their own destiny.
Undo the theft. Give us back Owl’s Head.
Posted in Nova Scotia, Owl's Head, Uncategorized
Leave a comment
Sine-Saloum Delta, Senegal. A tiny exploration.
I recently spent a few days in the Sine-Saloum delta in Senegal. You have likely never heard of this delta and that’s not surprising. It’s small and not very well researched. As a delta sedimentologist, I was mesmerized by the little bit that I discovered on location and by reading up on it later. Like all deltas, people have interfered with it for a long time, thought not at the extent of e.g. the Rhine or Mississippi Deltas, but still – it’s impossible to write about it without mentioning human activity.

Western Senegal and the Sine Saloum Delta. The distance from the city of Kaolack to the coast is ca. 100 km. We explored the delta from the small fishing town of Djiffer
The delta is formed by two rivers, the Sine and the Saloum. This area, at roughly 13degN, is on the southern edge of the Sahel region, which has experienced increased and devastating droughts since 1970s, as as result of which the flow of the rivers is so small that this has become is a Reverse Estuary: the salinity of the water increases in a landward direction. Precipitation is controlled by the West African Monsoon, which has a regional variability across Senegal. In the area of the Sine-Saloum Delta, annual rainfall averages between 850-1000 mm, almost all of it falling between June and October (Raj et al., 2019). The tide range at the coast is semi-diurnal with a maximum range of ca. 1.5 m.
This area is part of the Senegal Basin, the sedimentary wedge here is more than 4,000 m thick. I have not been able to find what the specific geologic basis for this modern, relatively small drainage basin is. The much larger Senegal River basin is hundreds of kilometers to the North and the sizeable Gambia River basin ca 100 km to the South. Many of the big rivers on this side of the continent are situated along Precambrian basement structures, but again, I haven’t found out the reason of the Sine-Saloum topographic low.
Part of the delta coastline was was declared a Ramsar International Wetland in 1976 (https://www.ramsar.org/wetland/senegal). It deserves this recognition because it is an important wintering habitat for (northern) European migratory birds. Because we were there in February, we saw storks, spoonbills and many European wading and meadow birds such as oyster catchers and curlews.
The area received recognition as a UNESCO World Heritage Site in 2011 (https://whc.unesco.org/en/list/1359/). The WH designation is earned for its universal value as a cultural landscape, namely more than 200 magnificent shell middens, some hundreds of meters long and several meters high. Twenty-eight of the mounds have burial sites with remarkable artefacts. Prehistoric people lived here since at least 5,000 years BP. UNESCO: “The middens are important for improving the understanding of historic cultures and testify to the history of human settlement along the coast of West Africa”. The historic middens consist mostly of the West African blood cockle (Anadare senilis). An analysis of the growth patterns and monthly resolved δ18O profiles of some of these bivalves in one of the prehistoric middens suggests that the West African Monsoon (WAM) has shifted over recent times. The time interval studied, 460-1090 AD, was consistently wetter than it has been in the 20th century, possibly because of a shift in the Atlantic Meridional Overturning Circulation (Gulf Stream)
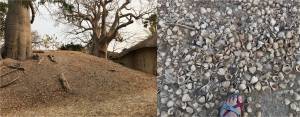
One of the many middens, almost entirely consisting of shells of the bivalve Anadare senilis. This midden is on the grounds of a guest facility.
The conservation efforts have led to a bit of tourism and hence some income for the local population, the Sereer people. This group fled from ca. 300 km further north along the Senegal River to the Sine Saloum delta ca. 800 years ago. They fled the islamisation of the region and remain mostly Catholic to this day. They are therefore unrelated to the prehistoric people who built the middens.
The Sereer people do not eat blood cockles, they eat only the swamp oyster (Crassostrea gasar), which grows massively on mangrove roots in the delta. Only women harvest the oysters. They live for several months in makeshift camps in the delta. They harvest the oysters at low tide, cook, shuck and dry them. Then – so we were told – they are packed and sold. Oysters are highly prized so the women have a parallel (cash) economy. The oyster harvesting also results in middens, and they too are big, as we witnessed (see below).
The men fish offshore and in the mouth of the estuary in their big, colourful hand-built pirogues. The fishing stocks have declined and it’s hard to make a living. The fish (kettlefish and sole, among others) is exported in cooled trucks directly from the dock in Djiffer and shipped to Europe. There is sardine fishery too, but this is done only by Guineans, not by the Sereer. The sardines are cleaned and dried and exported.
 Pirogues in Djiffer
We boarded our pirogue in Djiffer, now the southernmost point on this long sandspit (the longshore current flows from North to South, obviously), but it hasn’t been the southernmost tip for long, because the spit was breached by a storm in 1987 and the breach has never healed. The Ramsar Wetland is the uninhabited spit remnant south of the river mouth.
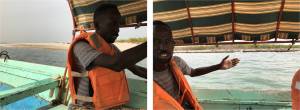
Two pictures taken just South of Djiffer. River mouth is to the left in the LH picture. Active sediment reworking takes place. In the RH picture our guide (a local Sereer man who was very knowledgeable and spoke both French and English as well besides his native language Wolof) points to the remains of mangrove roots which were cut down by local people here until a few years ago.
There was much wave breaking at the river mouth, so it’s very shallow – a dynamic sandy environment. After the spit breached, some shore parallel sediment reworking took place along the inner part of the delta. Mangroves were cut cut down for firewood until a few years ago. As our guide said “yes, they used to cut mangroves, they had to cook food and there was no propane, what choice did they have?” Now that propane is available again, the mangroves are beginning to grow back, providing much needed protection against erosion. They are also actively planted and are regrowing well.
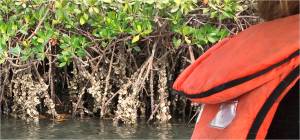 Swamp oysters (Crassostrea gasar) growing on Mangrove roots along the tidal channels in the delta.
We stopped at one of the modern-day Oyster middens. It was late morning and the women were asleep in their hut and we didn’t disturb them. This modern oyster day midden is enormous, it’s even visible on Google Earth!
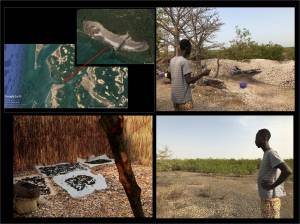 Clockwise from top left: Modern Oyster midden that we visited visible on Google Earth; an impression of the relief of this modern midden; unvegetated area landward of the midden; processed oysters drying in the temporary camp of the women.
Behind the oyster midden, also visible on the satellite image are bare areas. My guess is that these flood only during Spring tide and that the soil has become so saline that nothing else grows there the rest of the time. But I’ll happily be corrected.
Artisanal salt mining
Small scale salt mining has massively changed the supratidal flat areas. It looks like this industry involves exclusively local, informal labour (including children), the salt is bagged and shipped off by large trucks.
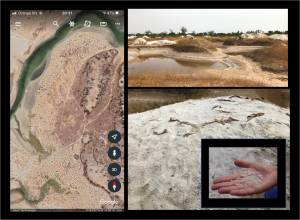
Artisanal salt mining a few kilometers NE of Djiffer. Left hand panel: Google Earth image showing the supratidal flats dotted with hand-dug salt pans. Top Right: salt pans are ca 5 meters across. The humps in between are mounds of salt, usually covered with tarps, waiting until the salt can be bagged and exported. Lower Right: uncovered salt mound with some beautiful cubic NaCl on my hand.
Fantasizing about the sedimentology here, I was trying to come up with a schematic sequence for this delta and realized I don’t quite have enough information to sketch one. Its main components are fine sand, mud, evaporites and colonies of Oysters and Cockles. I’d love to find out more. And I’d love to return.
References
Azzoug, M., et al., 2012, Positive precipitation-evaporation budget from AD 460-1090 in the Saloum Delta (Senegal), indicated by mollusk oxygen isotopes. Global and Planetary Change, v. 98-99, p. 54-62.
Azzoug, M., M. Carre and A. Schauer, 2012, Reconstructing the duration of the West African Monsoon season from growth patterns and isotopic signals of shells of Anadara senilis (Saloum Delta, Senegal), Paleogeography, Paleoclimatology, Paleoecology, v. 346-347, p. 145-152.
Ecoutin, J.M., M. Simier, J.J. Albaret, R. Lae, L. Tito de Morais, 2010, Changes over a decade in fish assemblages exposed to both environmental and fishing constraints in the Sine Saloum estuary (Senegal). Estuarine, coastal and shelf science, v. 87, no. 2, p. 284-292.
Hardy, K., A. Camara, R. Pique, E. Dioh, M. Gueye, H.D. Diadhiou, M. Faye, M. Carre, 2016, Shell fishing and shell midden construction in the Saloum Delta, Senegal. J. of Anthropological Archaeology, v. 41, p. 19-32.
Raj, J., Hamza Kunhu Bangalath, G. Stenchikov, 2019, West African Monsoon: current state and future projections in a high resolution AGCM. Climate Dynamics, v. 52, p. 6441-6461. Open Access: https://link.springer.com/article/10.1007/s00382-018-4522-7
Vidy, G., 2000, Estuarine and mangrove systems and the nursery concept: which is which? The case of the Sine Saloum system (Senegal). Wetlands Ecology and Management, v. 8, p. 37-51.
Posted in coastal systems, General geoscience, Geoheritage
2 Comments
Our First Full Year under Solar Power
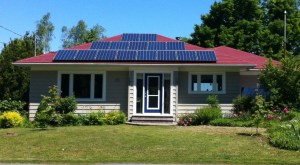
The quiet revolution on our roof started a year ago and we’re loving it. So here’s everything you have always wanted to know about installing solar power (in Nova Scotia).
Location location
We live at 45N on the right side of the continent, exposed to the Labrador current. Result: very cold winters. We average 1,806 sunshine hours per year, distributed over 287 days (source).
In 2002 we rebuilt and expanded this modest 1950 bungalow into a roomy house. We did look into installing heat pumps then but the house never had ducts, and we didn’t want the (extra) construction. We added a studio (for my artist husband). The studio is expensive in winter: it’s a separate 324 sq ft (36 sq m) building on a concrete slab with in-floor heat supplied by its own hot water tank. It’s very well built and insulated but still costly. The studio heating system is completely turned off from mid-May June to mid-October. It has a programmable thermostat; the artist doesn’t keep it very warm and uses a stand-alone space heater (and special studio woolly!) when he is there on cold days. We don’t have air conditioning anywhere.
The original bungalow never had a furnace. It was heated with wood and electric baseboards. We upgraded the latter to efficient electric radiators and installed a programmable thermostat in each room. The house has an insulated basement which contains utilitarian spaces that don’t need (much) heat. The basement also contains the guest room which faces the garden and two of its walls underground. We have an airtight wood stove which essentially heats the main floor (living/dining/kitchen, our bedroom, my study). It burns through 2 cords (7.2 m3) of hardwood between early December and early April. In the middle of winter, the stove burns 24/7 for about two months. The house and studio are 3,200 square feet (356 square meter) large with standard 8 ft (2.30 m) ceilings.
Because it never had a furnace, the electricity bills were always high, wood stove or not.
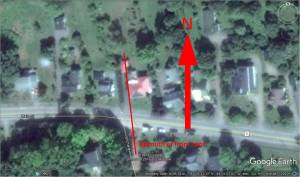
Here is our house on Google Earth – the red roof is us. The solar panels are on the front (dark triangle). The front of the house is oriented SSE.

This picture was taken in March from the front steps looking south. There is a big maple tree on the corner of the property (left in this picture) but it never gives shade. The big house to the right sits higher and is surrounded by large deciduous trees. When the sun is lowest in winter, those bare trees (on the right in the picture) do actually block the afternoon sun, as we’ll see later.
Research and investment
Our research was made simple thanks to an energy expert friend who provided free advice. He organized a field trip to the house of someone who had installed solar panels and we got to see the whole thing and ask every question we could think of. They had also thoroughly researched solar panel companies so we went with their advice and recruited Fundy Solar out of Moncton, NB.
Before we continue, this fact sheet tells you what earth materials are used to make solar panels.
The prognosis for our house, given its exposure and the number of panels we could install, was that we would produce 4 to 4.5 MWh. We decided that would be worth the investment because that could be 1/3 of our annual total electricity bill (sneak preview: we produced 4.42 KWh, indeed almost 1/3 less than our previous power bills!).
We signed the contract with Fundy Solar in the late Fall of 2015. The total bill was Can$15,000 for 15 panels. The price has since dropped of course. Had we been able to add more panels, it would have been cheaper per panel (i.e. I’m not suggesting it was $1000/panel, that was an accidental outcome). There is no subsidy for adding renewable energy to the grid in Nova Scotia, the investment was ours.
We don’t store! We didn’t want batteries and a whole separate wiring system. We have a contract with Nova Scotia Power: we provide power to the grid and get reimbursed at the standard rate. Other (Canadian) jurisdictions have incentives for solar, such as a one-time subsidy and/or a higher price for energy produced, but that’s not the case here.
Because we are now an electricity supplier for Nova Scotia Power, they have a role in it as well. NS Power inspects the installation of the panels twice, once at rough-in stage and once at the very end. Fundy Solar installs the panels, but the electrician is independent and is licensed by NS Power. The licensed electrician meets twice with the NS Power technician at the property for the inspection. After the last inspection, NS Power installs the 2-way meter and flips the switch!
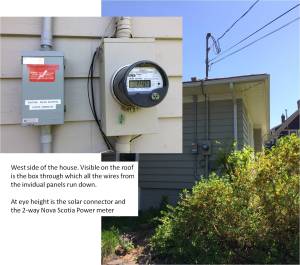

What it looks like on the outside of the house and in the meter-closed right behind it. The diagram shows all the technical details, the box below it is part of the Enphase system, which I talk about below
The bill from Nova Scotia Power now includes two meter readings, one for KWhs used and one for KWhs sent to the grid.
The panels will work efficiently for at least 20 years. By that time newer models will have come out and the future owners of our house will update the system.
Keeping an eye on those lovely data
The truly fun part of this adventure is Enphase, the internet-based system that lets you keep track of what your panels produce and do all the statistics. Enphase tells you every 15 minutes how much the panels have produced and there’s an app of course, so you can check your panels’ workings wherever you are in the world (and our solar company has access to our Enphase as well, so we can communicate about possible failures with them).
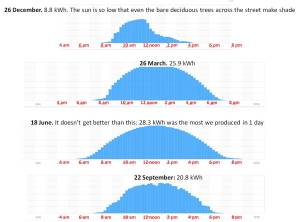
Enphase’s output for 4 very sunny days close to each solstice. The system gives a reading every 15 minutes.
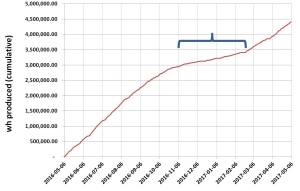
Cumulative production in Wh from May 6 2016 to May 6 2017, our first full year. The blue accolade shows that we produced not quite 500 kWh between early November and early March. In other words: almost 90% (the other nearly 4,000 kWh) was produced during 8 months. Production during the 4 winter months is almost negligible.
Snow
We have a metal roof from which the snow slides off fairly quickly. The panels are smooth and also function as a slide. But, depending on the amount of snow, it will be on for a few days. Enphase then gives an error warning, which would be the same in case of a power outage (which we didn’t have all year). See picture below. We lost 3 weeks of production to snow, but that was all during the season that the sun is so low and the days so short that we don’t produce anything meaningful anyway. The exception was late March when we suddenly had 2 sunny days under snow.
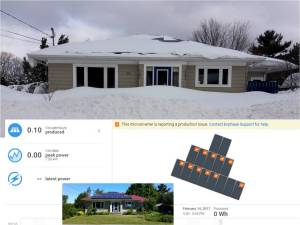
Panels covered in snow. Most inverters don’t get any input and produce an error message (orange icon in corner of panel)
Conclusion
You can’t not do this even in our jurisdiction which lacks subsidies for solar. We save money every day and we use fewer fossil fuels and are just as comfortable as we were before. So here we are: wood and solar are the way to go in Nova Scotia!
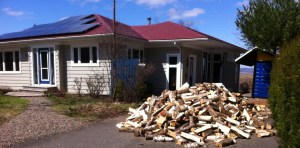
Posted in climate change, Energy
1 Comment
My Brilliant Career: a woman geoscientist looks back (posted on #IWD2017)
In November 2016, I gave a talk to the brand new Dalhousie University Chapter of the Association of Women Geoscientists. When I asked the women what they were looking for in a talk, they weren’t very specific other than that they wanted to hear about my career as a woman in earth science. I decided to keep it light-hearted but pertinent.
The feedback was positive and there was even interest from further away (thanks to a Twitter announcement of my talk), so I decided that this was the opportunity for a blog post reflecting on “My Brilliant Career” (this title inspired by one of my favourite movies). Warning: there are Lessons for Women in here!
=====
1. Why Geology / Earth Science?

This is me in the summer 1969 when I was 16. I’m sitting on a rock in a lake in southern Norway on a family holiday. The picture characterizes me well: I would rather be outside anytime; I was a tomboy. I often say that I didn’t choose geology, it choose me. It suited me. I wasn’t conscious of that for many years because nobody in those days talked about those sort of things.
I’m from the Netherlands originally, a baby boomer. I grew up in the boring ’50s and ’60s (I was just too young for activist ’68 when it came along). Women were expected to be mothers. There was no discussion of careers or choices. Nowadays, women still experience those sorts of pressures although they are more subtle. We must learn to love ourselves for who we are and make choices regarding our future that suit our character.
2. The Netherlands: Undergraduate and MSc

Left: the Geology department building of Groningen University (now a conference centre). Right: “Actually, we’re here looking for husbands, and if that doesn’t work, we’re getting into nuclear physics”
I did my undergraduate degree at Groningen University in the Netherlands. I started out in chemistry, but quickly migrated out. I then meant to major in biology, but ended up taking geology classes and loved the mapping part. It was eccentric, the department was housed in an iconic, beautiful building, there were hardly any students, I was the only girl.
I started university in 1971. Girls in the Netherlands of my generation and background (upper middle class) typically did not have “working mothers”. None of my friends’ mothers “worked outside the home”. Yes, we did have a few women teachers in high school. They were mostly women who worked “because they had to” (i.e. they had no bread-winning spouse). The exception was my chemistry teacher, who was young, straight out of university, just married and fantastic. She was both demanding and hilarious and incredibly interested in her students as individuals. In hindsight, she was my earliest role model. I reconnected with her 40 years after my high school graduation!
I had many women friends who studied law, medicine, economics, chemistry, biology, but I cannot recall we ever talked about careers those first four years. I think many of us subconsciously assumed that we would end up like our mothers. But all those women friends did really well career-wise, whether they became attached and mothers or not.
I am the only woman to have ever graduated with a BSc in Geology from Groningen University. A dubious honour. But I never thought along those terms in those years. All my male fellow geology students were great pals. They had completely different backgrounds from me: many of them came from small rural towns close to Groningen. Not only was I the only girl, I was the only one “from away”. These guys weren’t part of my close social circle. In hindsight, I probably missed out on a lot of geo-socializing and likely also career-talk because of that situation, but I never thought about it. I was never very “girly” and I’m also not the timid type – I speak my mind. It was a good atmosphere.
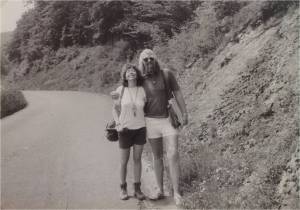
Fieldwork in the early ’70s.
Here is one of my long-haired fellow geology students. It was the ’70s, so all men looked scruffy. We went on many long field trips and I can’t remember how I negotiated the bathroom issue. More than 15 years later, when I began a teaching position at Utrecht university, the women geology students demanded that there would be two proper bathroom stops each day on each field trip. I was so impressed by this – completely reasonable! – demand. And I became acutely aware that I never asked for such a simple accommodation myself when I was a student. In my days, you simply adapted to the male world, you acted like a guy, because if you didn’t, you clearly couldn’t manage, you failed. Nobody thought that conditions should .change for women to enable them to fully participate.
I can’t recall finding the lack of bathroom stops a difficult challenge. Indeed, I did as the guys and when I had a period during long field days, I managed somehow – I can’t even remember how.
I was at a complete loss of how to proceed after my BSc. A year earlier I wanted to drop out and become a nurse. Fortunately my dad told me that was fine, but I had to finish my BSc first. Other than that, I experienced no career counseling. When I did get my degree (all in time and with good marks), becoming a nurse was no longer my ambition. I had decided to get my geography teaching certificate. So I ended up doing an MSc thesis on late glacial geomorphology of an enigmatic feature in the northern Netherlands, and – as a minor – I spent a semester learning about what is now called Geomatics and then I discovered Sedimentology, as a second minor (yes, it was a demanding program). Really, Sedimentology became my MSc more than the glacial thesis (which proceeded at glacial speed). I did get that teaching qualification. My parents approved.

Sedimentology fieldwork in the Oosterschelde estuary, Netherlands. Top left, our Research Vessel. Top Right: our 2×2 m tarp-covered observation station, on top of a large pylon rammed into the tidal shoal (picture at low tide). Below right: using the 4 hour low-tide window to insert hoses and pumps, enabling us to lower the water table temporarily, so we could dig a trench and make a lacquer profile (below left). The lacquer profile shows reactivation surfaces of multiple high tide events – I used these photographs for sedimentology classes in later years.
For my Sedimentology fieldwork, we worked on a tidal flat in the southwestern Netherlands where the tide range is about 4 m max. We studied the dynamics of sedimentation on the tidal flat, measuring currents and sediment movement throughout one entire lunar cycle. It was real team work and…. there were other women students. It involved a lot of responsibility, it required handling all kinds of gear, including a pontoon-like research vessel, in all kinds of weather and the best part was that sometimes (if it was your shift), you got to spend a night on the 2 x 2 m tarp-covered platform on a post 4 m above the tidal flat. You’d have to get off the platform at low tide to check the instruments out on the tidal flat and you’d be all by yourself on a shoal in the middle of the estuary in the middle of the night. It was terrific. I was hooked – I wanted to study sediments. Not one person had talked to me about what jobs one could pursue with a geology degree, but it was easy to see that studying sedimentology had huge relevance for coastal management (recall: it’s the Netherlands, they are kind of obsessed with battling the sea). Years later, I read John McPhee’s terrific “Rising from the Plains”, which contains this quote: “Geologists tend to have been strongly influenced by the rocks among which they grew up……. The wizards of sedimentology tend to be Dutch, as one would expect…..”. I don’t know that I became a wizard, but sedimentology sure felt like coming home.
It looks like such an odd choice: two thesis subjects in the Netherlands! In that minuscule country! Here’s another thing I learned about myself: I’m a backyard earth scientist: I have an urgent desire to understand the geology of my home base. I could have picked thesis areas in Spain, Germany, even Canada, but I stuck close to base. My furthest fieldwork area was in Belgium, in the Hercynian Ardennes fold belt, where I also worked as a TA during my MSc.
A few months before graduating with my MSc, I attended a conference on Holocene sedimentation in the North Sea. My sedimentology advisor displayed our tidal research theses prominently. There were lots of international participants, among whom quite a few Americans and Canadians: I made connections and ended up as a PhD student at Louisiana State University’s geology department.
3. The Deep South: Louisiana
Really, I didn’t want to to a PhD, but I wanted to leave the Netherlands and I didn’t want to work for an oil company, which would have been a secure and obvious way of getting international postings. Why not? I can’t really remember. So when a prof from LSU invited me to apply to the PhD program and I realized that Baton Rouge was pretty much at the apex of the vast Mississippi Delta (sediments!), I decided to take the chance. As one of my woman-geologist friend said at the time: “these Dutch people, they can’t stay away from flat delta plains!”
I spent one year as a full-time PhD student and I struggled. I really didn’t want to be in school any longer. I felt incredibly lonely, and I hated being that poor. I considered going back home, but that would be giving up and what would I do there?
After my first year, I landed a summer job with the Louisiana Geological Survey (LGS). I worked on their Geopressured-Geothermal project, a post-oil crisis initiative funded by the US Department of Energy. As a result of the oil crisis of 1973, the world suddenly became aware of the risk of being dependent on oil imports from unfriendly or politically unstable countries. That awareness led to increased government-funded R&D into earlier untapped domestic reserves. Fossil fuel reserves, of course, nobody thought beyond those quite yet.
I loved the job and I didn’t want to go back to being a poor student. At the end of the summer, LGS hired me full time on this project. Less than half a year later, my director appointed me to lead their somewhat foundering “peat project”, also an outflow of the oil crisis (peat burns, in case you wonder). Well, he didn’t just appoint me. He suggested I take this responsibility, he thought I could do it. I was aghast. I had never been in the field in the delta on my own, I knew next to nothing about its modern sedimentology, I had never been a project leader, I was still very new to the country. I was petrified that I would fail. I asked my boss if I could think about it and then I accepted a day or two later.
Lesson for women: no guy would have questioned this obvious promotion the way I did. Not then, not today, 35 years later. Women tend to underestimate their own capabilities, men overestimate them. I know that’s a generalization, but nevertheless. This particular boss was a special human being, one who was a master at encouragement and letting people grow into their potential. I never had a superior like him again. He left LGS shortly afterwards.
The peat project was incredibly challenging. Fieldwork required roaring around the vast Mississippi Delta plain in steaming heat and humidity, having to watch out for alligators, snakes, mosquitoes the size of dragonflies and electrical storms, to name the most obvious. We took hundreds of up to 10 m long vibracores in what ended up being largely floating marshes and tried to make sense of meters and meters of black gooey muck. I had a lot of independence and a lot of responsibility. I talked to world-famous experts on Mississippi Delta sedimentation and found out they had never looked at the muck I was looking at. I took in their advice about how to tackle this material and slowly began to produce results.
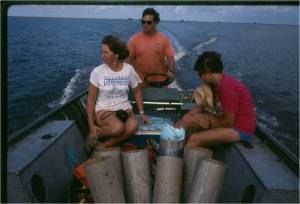
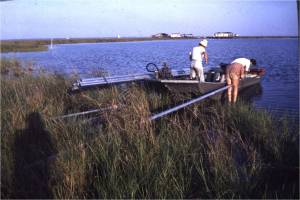
Fieldwork in the Mississippi Delta.
Then came the baby.
I had met a man and fallen in love and gotten pregnant. I was nearly 30, it seemed the right time.
Lesson for women: carrying a baby is still only a woman’s privilege. And whereas times have changed, it’s the woman whose body will get whacked by pregnancy and who has to navigate (field) work around breastfeeding, work travel and other such issues. The mother’s career will likely suffer a greater punch than that of the non-childbearing spouse. And the mother’s career choices will subsequently be more influenced by the question of whether that next career step has any possibility of improving the balance between her, her work, and the the needs of the offspring.
The US is an uncivilized country in many aspects: paid maternity leave is a luxury for some. LGS offered none but my director was extremely helpful given the circumstances. I ended up with 8 weeks, half of which unpaid. Other than cuddling baby, I used my maternity leave to write a paper and lo and behold, it got a ‘best paper’ award! My career was launched.
The fact that our income was insecure and small was a career saver. Lesson for women: once you have a baby, you want to take care of it – your brain actually changes so that taking care of baby is the only thing you want to do (call it instinctive if you wish). But that means that going back to work a few weeks after giving birth is not easy. It feels wrong (guilt feelings!). But I had no choice, we needed the money badly. Had I had a husband with a fancy income, I would likely have caved – at least for quite a while – and just cuddled that little creature in her onesie.
But I went back to work, and was happy quite soon. When my daughter was a year old I realized that I should revive that PhD ambition because I was likely going to remain the bread winner. My “peat project” had become part of LGS’s Coastal Geology Program (turns out you can’t burn Louisiana peat, but it’s a very sensitive part of the Holocene stratigraphy; delta plain erosion and stability depends much on its properties), a program to find solutions for the rapidly disappearing Louisiana coastline and delta plain (I wrote about that subject here). We were now a team of seven young geoscientists and we all pursued our PhD as part of our job, encouraged by our employer.
So when the baby was a toddler, I became Dr. Kosters
Before moving on to the next phase, I need to emphasize one thing. We have just covered 15 years of study and work. I was in the field a lot during those years. Often, I was the only woman in a crew. I was never sexually harassed, bullied, made to feel inferior or jeered at by any of my male supervisors, colleagues or assistants. This study showed that, out of 666 respondents, only a shocking 25% was never harassed. With many more of these stories now coming to the surface, I feel it’s important to salute the men I was surrounded by for all those years. At the time I thought that was normal (as it should be).
Somewhere in these first few years in the US, I became a feminist. Indeed, it took that long and I have often wondered why because the second feminist wave was almost over by the time I became convinced. I’m pretty sure that I finally started thinking about women’s rights because one of my friends in Louisiana was an Equal Rights Amendment activist and those discussions brought me around.
4. The Deep South: Texas
Shortly after getting that much desired title, I started a job with the Texas Bureau of Economic Geology (= Geological Survey of Texas). “The Bureau” was and is a highly reputable organization, this was an upward move, although I was of course leaving my research behind. I did not mind that. I was ready for new explorations.
At BEG I worked on yet another post-oil crisis project: the “Atlas of Major Texas Gas Reservoirs” (they still sell it!), a data compilation and analysis of more than 4,000 individual gas reservoirs and their specific parameters. I became a walking encyclopedia about Gulf of Mexico gas reservoirs. I was unhappy at times about what seemed an endless tunnel of database building, but I did learn an immense amount about energy security and natural gas reserves.
Had my relationship not gone on the fritz, I would likely have wanted to stay at the Bureau for a long time. It was a well run ship with great job opportunities. I had terrific colleagues and Austin is a nice city on the edge of the beautiful Texas Hill Country.
But that wasn’t to be. I became singularly responsible for my daughter and was in much need of family support. I accepted an academic position at Utrecht University’s Department of Earth Sciences after only two years at BEG. The logistics of single parenthood would be much simpler in the Netherlands, and doesn’t everybody with a PhD want an Academic career? It was very hard to leave terrific colleagues and this reputable organization.
5. Back in the Netherlands: Utrecht University
On the personal side, this was a great move. I found a lovely townhouse across the street from a superb public elementary school. I found a terrific local babysitter. I had supportive family members close by and a lot of old friends. After a bit of a rough start, my daughter (then 5) started to thrive. That made it all worth it.
On the professional side, I found it difficult. The Dutch university system is very different from the North American one. Departments are organized into groups of different specialties (for earth science those may be structure/tectonics, sedimentology, stratigraphy/paleontology, geophysics, petrology, etc.). These groups are run hierarchically by the head of the group, the only person who is a full Professor. You may be an assistant of associate prof your entire career (you would be tenured). The only person entitled to graduate a PhD student is the full professor.
But I was hired in a hybrid position, the result of an effort to break down some of the existing silos between some of these specialized groups. Several profs had successfully argued for increasing the marine geoscience research effort. They were a geochemist, a micropaleontologist/paleoceanographer, and a geophysicist. They made the case for hiring a sedimentologist – me. That pretty much defined the context for my future research.
I got along well with them from the start. I dreamt up new projects, getting generous access to ships from the Netherlands Institute for Research of the Sea (NIOZ) and I went to work on existing data of my new colleagues.
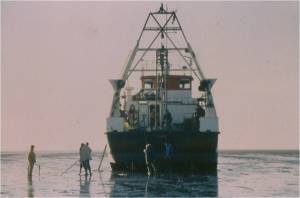
Fieldwork with NIOZ’s amazing RV “Navicula” in the Dutch tidal sea at low tide. This flat-bottomed vessel draws 50 cm water and can be set on the tidal flats as a lab / workspace. It also had a fantastic crew of 3.
But as a faculty member I resorted within the Departmental Sedimentology Group where I taught sedimentology and stratigraphy classes. I really liked teaching and the interaction with the 18-24 age group. I put a lot of time and effort into developing new classes and labs. That’s typical for a new faculty member. I also reached out to Big Oil and managed to convince them to support some of my early research projects. Later, they funded a multi-university project (6 MSc theses) with me as the academic partner in the Carboniferous fluvio-deltaics of eastern Kentucky (a few weeks fieldwork in the US again).

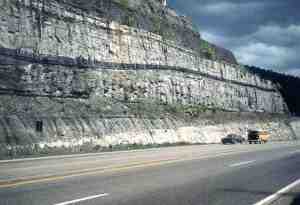
Left: pondering tidal rhythmites in Carboniferous deltaic distributary mouth bars in eastern Kentucky. Right: fluvio-deltaic sedimentary sequences (including coal) in eastern Kentucky
But the then-head of that Departmental Sedimentology Group had his own ideas about how that group should profile itself and a “non-fundamental” sedimentologist (me!) wasn’t his preference for what he considered a stolen job opening (stolen by what he considered the “marine geoscience coup”). I wrote earlier about my thoughts and experience regarding women and fundamental research. He managed to find funding to hire a “fundamental” sedimentologist as a post-doc. The guy was excellent, a wonderful person, older than me, with more publications. He got the office next to me. Did this make me feel insecure? You bet. Did it create stress within the Sedimentology Group? You bet.
And whereas I did spend time in the field doing research, I did not join in teaching multi-week undergraduate field schools in Spain and Italy because it meant leaving my daughter alone for longer than I thought was good for her. While I had no problem making that decision as the best option for our little family, I didn’t think it helped me in improving my reputation within the department. In all honesty, I had no reason to be worried, because nobody ever suggested I wasn’t fulfilling my duties. In fact, two of my colleagues (all male, I was the only female faculty member) expressed explicit support for me in my specific situation. But I felt insecure nevertheless. Imposter syndrome was rearing its head, especially with my brilliant colleague in the office next door. Because I had always behaved as ‘one of the guys’, I had not allowed myself to become aware of the (subtle) differences that make Academic women feel less appreciated, such as in academic publishing.
When I look back at my academic production of those 4 years at Utrecht University now, I am impressed. I taught 5 different classes, started up new research, had 3 cooperative projects running with my marine geoscience colleagues and was coordinator for a European marine geoscience exchange program with 11 departments in 10 countries. I started to publish my new research.
But at the time I thought I was under-performing and more than anything I dreaded having to leave my daughter for 6 weeks for an ocean-going research expedition. In addition, I began to wonder whether I was fit for Academia. I wasn’t “fundamental” after all. And would I be able to keep up the drive to be “original” for another 25 years? In addition, being back in my home country fueled my interest in the political drivers of universities.
I started looking for other opportunities. By some weird fluke, a new opportunity presented itself soon, right around the time that I got tenured. I accepted tenure and resigned a week later. The fundamental post-doc next door ended up getting my position. I was happy for him (he had 3 kids to support!). He did well, he retired from that post last year. My colleagues were stunned by my departure and I felt forever sorry for those who had worked hard to recommend my tenure. But I knew that this move would be better for my/our personal situation and hoped it would eventually better for me professionally.
6. The Advisory Council for Education
I was almost 40 years old when I left my profession for a job as a policy advisor for Higher Education in a brand new government-funded think tank of the Ministry of Education. The pay was excellent, the hours predictable, the commute the same. This was a much more balanced life for my daughter and me.
The job was a crazy roller coaster. I felt like a complete novice when I entered the policy-advice arena. Nothing that I thought I knew or understood, applied here. I learned about policy and politics. I relearned to write in Dutch. I read and read and read and debated and debated and I learned tremendous amounts from my sparkling colleagues who had backgrounds in linguistics, anthropology, history, geography, physics, sociology and …. education. I built a completely new network.
The Government always wants to be an exemplary employer. I was offered a top notch women-only training and self-awareness program. About two dozen women were selected to participate. For the first time I learned about myself, how I functioned in organizations, what complementary talents other people had, how one should build a team with explicitly diverse talents. Until that time, I had only been judged on the basis of content (scientific production), never had I been asked to think about how I functioned within a group. I take that experience with me the rest of my life.
I call these 2.5 years my highly paid sabbatical. I’m pretty sure I didn’t say or write anything that improved Higher Education in the Netherlands, but I learned an immense amount and I can confidently say that I applied that later.
Shortly after I started this job, my director asked me what I hoped my next job would be. I thought that was an excellent question: do not assume your employees will hang around the rest of their career. As it was, he was also encouraging us to think about our future careers because he knew that the political future of this think tank was insecure. He was right, Parliament voted it out of existence within 3 years after its much publicized start.
But when he asked me that question, we didn’t know that yet. So I answered truthfully: that I’d ideally like to combine what I was going to learn at the Advisory Council with my international expertise as an earth scientist. He thought that made sense.
And I ended up being able to do that.
7. The International Institute for Geoinformation Science and Earth Observation / ITC
 ITC’s new building in 1997.
ITC was, from 1950-2010, an independent graduate school, focused on training young professionals from non-western countries in what we now call Geomatics and its applied fields (geology, hydrology, soil science, ecosystem management, agriculture). ITC was created by the Netherlands government in 1950 as a contribution to brand new UNESCO. The Dutch government provided fellowships to young professionals from relevant organizations in non-western countries to be trained with new technologies in aerospace surveying and applications. Dutch students could also take courses, as I did in the late ’70s as part of my MSc.
In the early ’90s ITC was being challenged as an independent institute. Dutch universities were internationalizing and wanted access to these fellowships so that they too could offer money to foreign students (not: young professionals – major difference). The political powers wanted ITC to – eventually – become part of the University system, but ITC itself felt that the time wasn’t right – yet. Its visionary director was convinced that the Institute should first get serious in research. Until the mid ’90s, it offered a 1-yr postgraduate diploma and a 2-year MSc degree. Because ITC wasn’t part of the university system, it couldn’t offer a PhD degree and wasn’t easily capable of developing PhD supervisory capability since many of its faculty didn’t have PhDs themselves.
By some weird coincidence I became aware that ITC’s director was looking for a qualified interim person to advise them how to move forward. I became that interim person and was seconded to ITC for 4 months at the end of which I presented them with advice, after which I was hired as their Dean of Research & Graduate Studies, a brand new position.
The job required a move, something my then nearly 12-year old did not take easily. It was very hard to have to move, but I had confidence that Enschede had more to offer for her as a soon-to-be teenager than the small town where we had just spent 6.5 years. It did, eventually, but this was a difficult time.
In cooperation with ITC’s science advisory committee, I developed a tailor-made PhD program that involved PhD candidates having a university-based advisor as well as an ITC-based advisor and it also included options for non-PhD faculty who wanted to move ahead. It was very challenging because – again – the institute didn’t have PhD granting status and not a big research tradition, Dutch universities weren’t used to cooperating with non-PhD granting institutes and some universities saw ITC as a threat. In addition, some of ITC’s faculty saw me as a threat, because I sat on a rather large pile of money and they were used to dispense that money amongst themselves without much interference from others.
This loss of purse-grabbing prompted one of them, a rather archaic man with a particularly large ego, to tell me “nobody likes you” (because, you see, a woman is supposed to be “nice”). Aha! Whereas I don’t think very well on my feet, I was able to calmly tell him that being nice wasn’t part of my job description. Lesson for women: don’t concern yourself with being “nice”! You’re hired to do a job – it’s not a popularity contest. That’s hard, most women have to unlearn being nice.
When I left 7 years later, ITC’s PhD program had the best time-to-degree rate in the Netherlands and it became part of the Dutch university system a few years later.
So I didn’t work as an earth scientist for what ended up being 10 years. But I was active and visible in the earth sciences. I attended conferences and published a few papers. I became president of the Royal Netherlands Earth Sciences Society KNGMG, I served on a government panel for the management of the tidal sea and on review panels of the Netherlands Science Foundation and of the EU. I wasn’t “just” a paper pusher.
I was also active in two professional women’s networks – an immensely rewarding experience and I can’t stress enough how important such a connection is. Real face-to-face networking is still of utmost importance. Of all my jobs, only the Advisory Council job came through an ad and I didn’t know a soul at that organization. Every other job or contract came through people I knew personally.
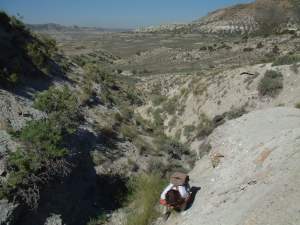 Green River Basin fieldtrip in the late ’90s
I also met my Canadian husband at ITC. After 7 years at ITC my daughter graduated from high school, my husband retired, I resigned and we all moved (back) to Canada. It was not an automatic choice. We thought about staying in the Netherlands, where I had twice been invited to apply for senior leadership positions in government / academic institutions. No doubt my career would have evolved in an exciting and professionally highly fulfilling direction if we had stayed. But I thought that it would be better for our new family to be in Canada. Did I make a typical woman’s choice? Maybe. But I haven’t regretted it despite the fact that this move professionally didn’t pan out as I hoped it might.
8. Across the ocean again: Nova Scotia
We arrived in Nova Scotia a few months before I turned 50. I took my first long “sabbatical”. It ended up being two years. We rebuilt a house, we found a new balance in our life, we built family relationships. My husband had a couple of challenging health issues and all this took time and energy.
Professionally, Canada was completely different from the US, where they simply throw you in the deep end and you’ll find out if you sink or swim. That can be exhilarating and scary and I had loved it early in my career. In Canada they are interested in whether you have “Canadian experience”. I didn’t have that and because I wasn’t a young starter, that was a big problem. But I did have professional contacts in Canada. I didn’t count on working as a geologist at all, but geologists were the people I knew and that’s how I ended up getting work.
I worked as an independent for 12 years. I taught sedimentology & stratigraphy at both Acadia and Dalhousie Universities. For five years I served as executive director of the Canadian Federation of Earth Sciences and in between I was involved in running field schools for young professionals in the petroleum industry. I served as president of the Atlantic Geoscience Society. I tried hard to get a foot in the door in the R&D around tidal energy development here in the Bay of Fundy and Minas Basin, but despite attending conferences and workshops and presenting papers, I got nowhere. To this day I don’t understand that.
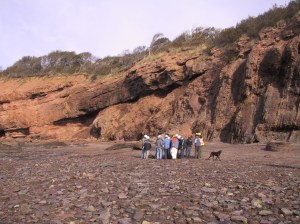
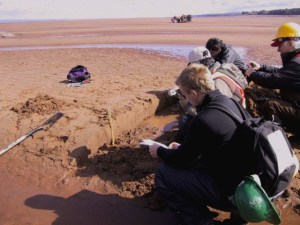
Teaching sedimentology – ancient and modern – along the shores and on the tidal flats of Nova Scotia’s Minas Basin.
Maybe I should have been more aggressive about finding work, but I also cherished our new life. So at times I struggled a lot with my diminished professional life and – in extension – my diminished income and therefore independence. And at other times I was ok with it. My husband was supportive, he was completely prepared to move again if I had found a dream job that would require a move. But our happiness here was more important to me in the end.
9. Lessons for women
There are lots of lessons for women, some of which I already highlighted above.
My career changes were heavily influenced by the fact that I became a single parent. That is life. I don’t regret it. My daughter is a happy, successful professional with global work experience in an important field, working on her PhD. I’m immensely proud of her. If I sacrificed parts of my career for her, it was worth it. Read this article by a famous feminist on how other women of my age may look back at such choices.
I have been spared sexual harassment but not discrimination. Today there is much more transparency about pay scales. The media regularly publicize the shameful “gender pay gap”. That notion didn’t really exist until this century so while I always assumed that I was paid the same as my male colleagues (why wouldn’t I?), that may not have been the case at all and it certainly wasn’t the case at ITC (I wrote about that here).

I was never sexually harrassed, but I know that is exceptional. I am astounded at the amount of sexual harrassment that surfaces in recent years and I truly wonder if things have changed for the worse over the years or whether I was just lucky.
But while I was spared sexual harrassment, I wasn’t spared bullying. I was bullied by my director during my time at the Advisory Council for Education but that was eventually managed well because it was part of the national government and they had good HR policies and professionals. I was very rattled, but then ITC recruited me and things turned around. I was bullied by 1 of my directors at ITC (not the one who hired me), but his turned out to be a very short tenure so I lucked out there (two male colleagues resigned as a result of his bullying – it wasn’t because I was female). I was bullied to such an extent by one of the CFES presidents that I resigned from that position. By that time I was nearly 60 and I decided that life was too short to suffer from big male egos. I’m happy that those egos have disappeared from CFES and that it is doing well now. The problem was that it was such a small organization that there was no way to turn.
Role models are very important especially for women and they were few and far between for me. I wrote about two of my role models here and here. Earlier, my above mentioned high school chemistry was important to me. During my first real job in Louisiana, I was immensely encouraged (although I met her maybe only four times) by the legendary Doris Malkin Curtis.
So what are the lessons I’d like to pass on to women of the next generation? Be true to yourself, don’t be afraid to ask for help, don’t worry about being (too) nice, join a women’s network, know your rights, be suspicious of big egos and just Carry Yourself With The Confidence Of A Girl Holding A Massive Owl

Posted in Women in geoscience
1 Comment
New Banner picture! Cobequid-Chedabucto Fault at Cape Chignecto, Nova Scotia
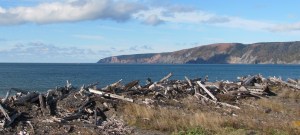
Figure 1. The western extremity of the Cobequid Chedabucto Fault complex in Nova Scotia. The Cape in the distance is called Cape Chignecto
It is a glorious view from the beach at Advocate Harbour. We look West towards Cape Chignecto. The coastline is straight. Eroding cliffs dip steeply down to the Bay of Fundy. This peninsula, the Cape Chignecto Peninsula, is a Provincial Park and the popular hike around it a tough three day journey. Kayaking around it is possible too even though the tide range averages 15 m here (I’ve done the kayak trip, the hike not yet). We also hope that this stretch of coastline will become a Geopark (I wrote about Geoparks earlier here).
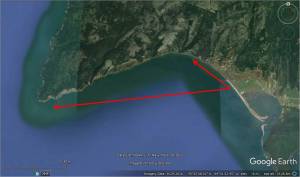 Fig. 2 Google Earth Image showing the location of the photo

Fig. 3 – Relief map of Nova Scotia, Prince Edward Island and part of New Brunswick. The white circle indicates Cape Chignecto.
The relief map above clearly shows several linear relief features extending eastwards from Cape Chignecto. These linear features are a series of faults, collectively known as the Cobequid Chedabucto fault zone, which extends East for more than 300 km from Cape Chignecto. Another name for it is the Glooscap Fault. Glooscap was the Creator God of the Indigenous Mi’kMaq people, the original inhabitants of this part of Canada. The fault is visible in the landscape as a clear, steep scarp.
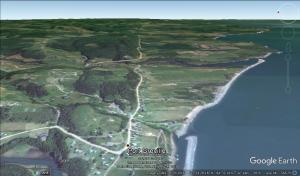
Fig. 4 – Google Earth Image of the Cobequid-Chedabucto fault (looking East) as expressed in the landscape east of Cape Chignecto. A road runs at the bottom of the scarp that marks the fault.
What happened here?
The fault zone separates the Meguma Terrane, the southern mainland part of Nova Scotia from the Avalon terrane, which stretches – in bits and pieces – to the North. Ok, so – What is a terrane and is that how you spell it?

Fig. 5 – Schematic map showing the southern Nova Scotia Mainland, representing the Meguma Terrane and the Avalon Terrane north of it, separated by the Cobequid-Chedabucto Fault zone.
A terrane (yes, that’s how it’s spelled) is a clearly identifiable fragment of continental crust, usually bounded by faults. So that means that the geologic origin of a terrane is different from that of its surrounding areas. The earth’s crust is formed by continent-size plates (continental and oceanic) that move around throughout geologic time. Moving around also means that plates and plate sections collide and slide along each other, sometimes causing pieces of crust (terranes) to break off from one side of a continental plate and become reattached to another one. Sometimes these terranes move around independently for millions of years before becoming attached again. Dozens of terranes have been recognized and we don’t always know where they came from and how they moved around over time.
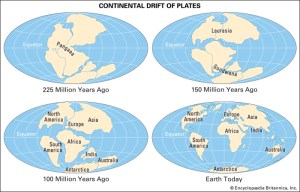
Fig. 6 – A very schematic representation of the movement of the continents over the last 225 million years. The Meguma terrane likely broke off from NW Africa (now Mauretania) after Pangea broke up and reattached itself to North America (from Encyclopedia Brittanica).
The Meguma terrane (southern Nova Scotia mainland) was most probably a piece of the margin of the Pangea supercontinent and came from the margin of the African plate, from what we now call Mauretania. When Pangea broke up, this piece of crust broke off and ended up attaching itself to the North American plate. Southern Nova Scotia is the only piece of Meguma terrane anywhere on the planet.
The Avalon terrane is bigger and very fragmented. Pieces of it are recognized from Connecticut all the way to Newfoundland and across the Atlantic Ocean into the UK and as far as Poland (the Atlantic Ocean didn’t exist yet when the Avalon terrane docked on to the continent, so the later opening of the Atlantic Ocean broke it up). It’s not clear where the Avalon terrane came from, but experts do have some evidence that these two terranes traveled together for a while before attaching themselves on the Northeastern margin of the American continent.
The Cobequid Chedabucto Fault zone marks the zone where the Meguma terrane docked and wrenched along the margin of North America after the Avalon terrane had become attached. Such faults are called “strike-slip faults”, a term that indicates that pieces of crust slide along each other (instead of over each other). The fault was probably active for 150 million years, from about 350 to about 200 million years ago. This sliding process wasn’t smooth – it would have been periodic and each movement would have been felt as an earthquake. The friction along these pieces of crust caused heat and fluidization of rocks, injection of hot fluids, and this together led to the concentration of valuable minerals and metals such as Iron, Copper, Cobalt, Barite and Fluorite.
The fault expresses itself in the landscape as a scarp, but when you put your nose to the rocks, the messiness of the grinding, sliding and friction is apparent. Here are a few examples.
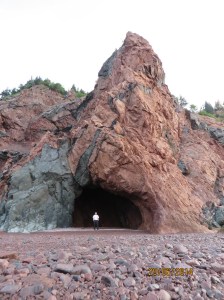
Fig. 7 A mixture of granites and dark colored igneous intrusions exposed along the beach close to Cape Chignecto itself. Person for scale
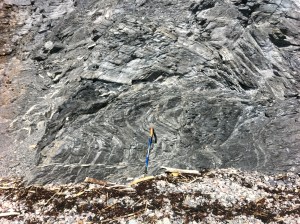
Fig. 8 – Intensely folded and faulted rocks exposed along the Cape Chignecto beach close to Advocate Harbour. Walking pole ca 1 m high
Fig. 9 – A piece that I retrieved from the outcrop of Fig. 8. These are ripples, formed on a beach some 300 million years ago. They became preserved as sedimentary rock and then the fault movement (my finger is on the fault line) displaced the ripple crests!
Is this relevant? You bet. First of all, ancient fault activity like this can cause concentration of valuable minerals and metals. Second, currently active faults like this one are seismic hazard zones. The best known similar strike-slip faults are the San Andreas Fault in California and the Great Anatolia Fault in Turkey. Understanding tectonics like this has lots of practical implications
Reference
White, C.E., and Barr, S.M., 2012, Meguma Terrane revisited: stratigraphy, metamorphism, paleontology and provenance. Geoscience Canada, v. 39 no. 1
Exxon, climate change and sequence stratigraphy
My favourite periodical is the New York Review of Books. It is a high-brow magazine that contains in-depth articles by outstanding writers and thinkers on a range of topics from fundamental physics to poetry and everything in between.
And excellent article in two parts – in the December 8 and December 22 2016 issues – discussed the Exxon climate change scandal. In case you missed it: Exxon (Exxon-Mobil since years, but generally known as Exxon) has known since 30+ years that our massive fossil fuel burning causes global warming, sea level rise and untold droughts and other catastrophic climate disruptions. The company chose to hide this information from the public and from policy makers and even financially support(s)(ed) climate change denial institutions and individuals to counter the growing scientific literature on the subject. All in their own financial interest, of course.
Exxon is now taken to court by the Rockefeller Family Fund. The accusation is that the company has failed to disclose the business risks of climate change to their shareholders and that this constitutes consumer (or securities) fraud. The articles in the NY Review present the evidence and the cover-up.
But that’s not a reason for writing this blog post. The reason is that in the December 22 article, reference is made to the man who conceived of what we now call sequence stratigraphy: Dr. Peter Vail. Quoting the article: “The company tried to use the work of one of its most celebrated earth scientists, Peter Vail, to predict how alterations to the planet’s surface made by the changing climate could help it discover new deposits of oil and gas”.
Readers of the New York Review of Books are knowledgeable intellectuals, but I decided that this paragraph was worthy of an annotation. So I sent the following to the Editor of the New York Review of Books. I consider this a bit of science communication, so I’m sharing it here because I’m curious whether my followers (geologists or non-geologists) find what I wrote correct / understandable / interesting / insightful. At this point, I don’t know yet whether the NY Review of Books will publish it, but that’s neither here not there. I have edited my original submission minimally and have included illustrations in this version. Here it is:
=====
Pete Vail (born 1930 – there’s lots about him on the internet of course) is a sedimentary geologist. He worked for Exxon his entire career. Among other things, sedimentary geologists have knowledge about so-called reservoir and source rocks.
Reservoir rocks are rocks with the right porosity and permeability, enabling (natural) storage of fluid or gaseous hydrocarbons (oil or gas). Source rocks are rocks that contain the right amount of organic matter and that have been “cooked” enough – i.e. experienced high enough temperature and pressure deep in the earth for a sufficient amount of time – for that organic matter to become transformed into oil or gas. Organic matter is the remains of living organisms, either plants or microscopic animals. Under certain conditions, organic matter doesn’t oxidize & disintegrate into the air (like the dead leaves you rake from your lawn in the fall) but becomes incorporated in sediments. Coal is simply dead plant material, “cooked” and incorporated in the rock record in the place where it originated (a swamp). Natural gas is mostly “cooked coal”. Oil is the end product of microscopic organisms that lived and died in oceans (and rarely in lakes) over time, then became buried and “cooked”. Oil and gas are mobile and will move under varying pressure conditions, thus ending up in reservoir rocks where they may stay trapped if other conditions are right. Petroleum geologists look for reservoir rocks and they need to understand the origin and architecture of these rocks. They also must understand and predict where and during what time interval the best source-reservoir rock combination may become preserved.
In 1977, the American Association of Petroleum Geologists published a bombshell. Memoir 26: “Seismic Stratigraphy – applications to hydrocarbon exploration” laid out a revolutionary new method of analyzing seismic data. Recall that this was three years after the oil crisis at a time when the western world and the US in particular was extremely panicky about its dependence on foreign oil. Anyone who could improve the prediction of hydrocarbon reservoirs in order to improve domestic production was going to be popular.
The cover of AAPG Memoir 26
Only oil companies have the financial resources and the motivation to collect seismic data. For Exxon to allow for their best kept secret – this new methodology – to be published in the public domain was mind boggling. The other mega company at the time, Shell, was humiliated and baffled by the insights presented in this publication.
Until the time of this publication, sedimentary geologists had developed models for understanding the rock record that relied on much smaller scale, i.e. field-based data collection. Seismic data reveal the architecture of sedimentary systems at the scale of tens or hundreds of kilometers, whereas field exposures are a few hundred meters at best. This is a difference of orders of magnitude, comparable to the difference between a standard land-based telescope and the Hubble when you want to study the universe.
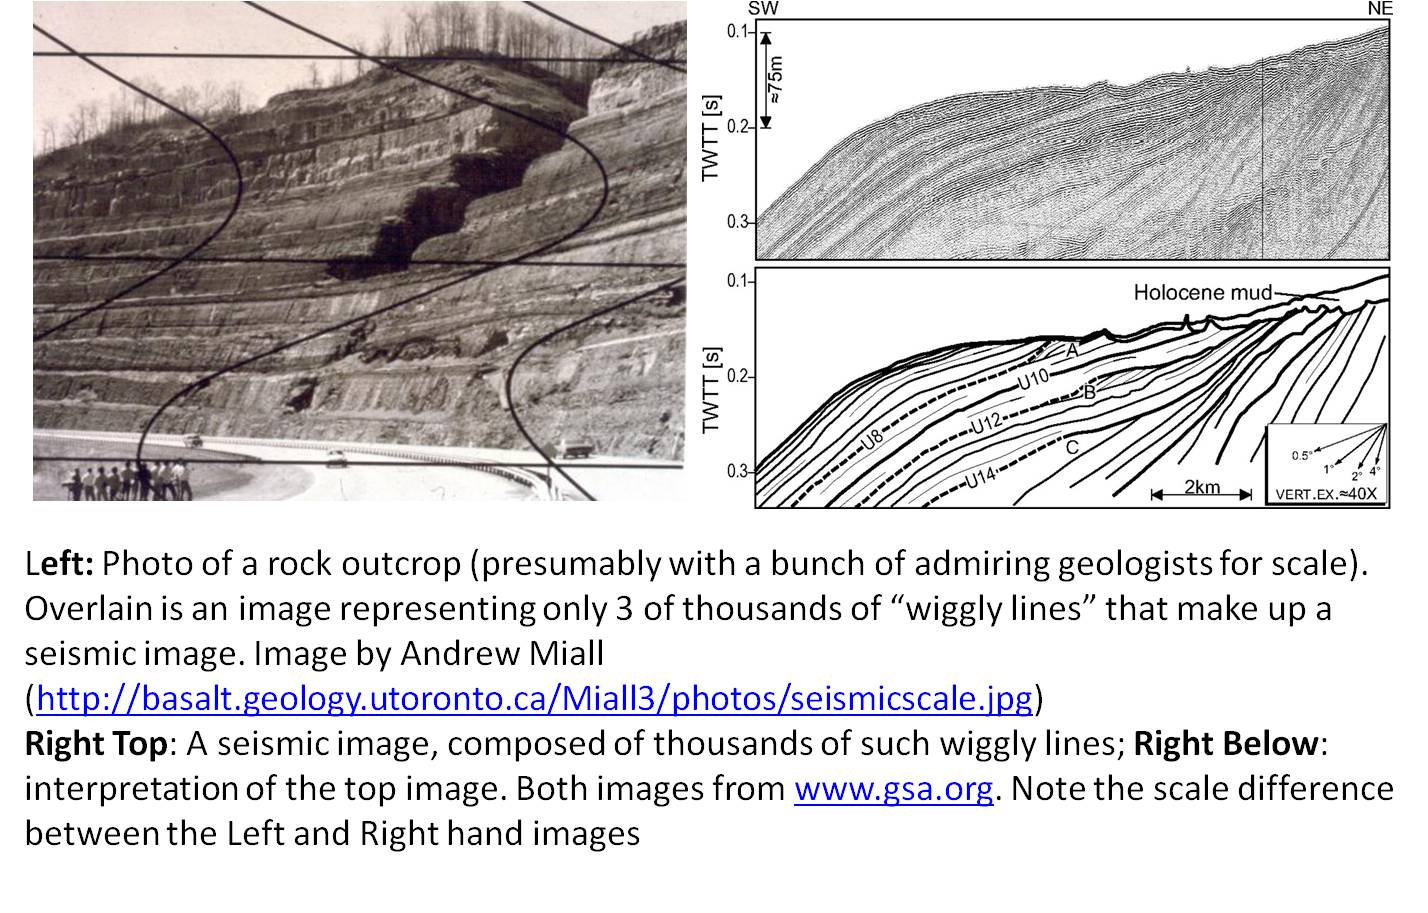 What the Exxon team, led by Pete Vail (a bright, boyish man gifted with contagious enthusiasm ), showed was that the location and preservation of recognizable packages of sedimentary rocks (“depositional systems”) depended on the position of sea level at any point in geologic time. Although much research had hinted at such a relationship, it had never before been demonstrated with so much conviction. So this was revolutionary but there was more: Pete Vail’s team claimed that these sea level changes were global in nature and they subsequently produced a global sea level curve showing sea level movements through time to substantiate their claim.

The first version of the “Vail/Exxon global sea level curve” (published in AAPG Memoir 26). The vertical scale on the left is time in millions of years. The two sea level curves on the left and right are the same, but the right hand one is at a higher resolution. The sea level curve on the left indicates that global sea level rose to a level higher than present from 500 until about 325 million years ago, then gradually dropped until about 225 million years ago, after which it slowly rose again, reached a peak at ca 90 million years ago and then dropped again. The curve has since been refined to a much greater detail. As an example, this article contains detailed sea level curves for the last 800,000 years – a time interval that isn’t even visible at the large scale of this diagram.
Geologists had accepted for a long time that global sea level danced up and down through the ages, but since sedimentation is capable of overwhelming the effects of sea level regionally, the idea that you could trace global sea level movement by analyzing sedimentary sequences seemed too ambitious. In addition, studying rock outcrops (or drill cores, for that matter) doesn’t give us a clear indication of time horizons. Our colleagues the paleontologists help us distinguish time by detailing small evolutionary changes in the fossils in the rocks, but we don’t actually see it. Yet Pete Vail demonstrated that variations in wiggly lines on seismic images represented time horizons, another revolutionary idea. Here is a video (one of a series) where he explains how he came up with that idea.
What followed were about 20 incredibly exciting years of research in sedimentary geology (I was one of many contributing to this field it in my own small way as a government and academic researcher) in which we sedimentary geologists started to look at sedimentary rocks from a completely different perspective. Our understanding of the timing and deposition of sedimentation expanded exponentially during these years. This knowledge revolution resulting in a methodology that we now call Sequence Stratigraphy. During that same period, roughly until the mid to late 1990s, the global discussion on climate change was marginal at best. Basically we lived by the paradigm that development required energy and that our field of expertise contributed to finding that energy even if we studied for example a thin, recently deposited sedimentary package. We worried about Peak Oil and about pollution but not about burning hydrocarbons as a factor in climate change.
Of course, as the decades progressed, the understanding of global sea level changes as a reflection of global climate changes also evolved, as did the understanding that Homo sapiens was becoming a geologic force itself, capable of changing climate. That’s where knowledge expansion is taking place now. Such is the nature of scientific progress.
So yes, the sentence in the article was correct “alterations in the planet’s surface, made by changing climate, can help discover new oil and gas deposits” but the road to that insight was long and the original objective was not climate study.
Of course, this doesn’t change the fact that Exxon brass, once they realized the importance of these findings and the potential damning consequences for the future of their business, took part in a massive cover-up, as outlined in these articles.
Posted in climate change, Energy, General geoscience
1 Comment
#Katrina10. #Louisiana is still disappearing
I wrote this blog post in November of 2014. I am reblogging it today, on the 10th anniversary of Hurricane Katrina.
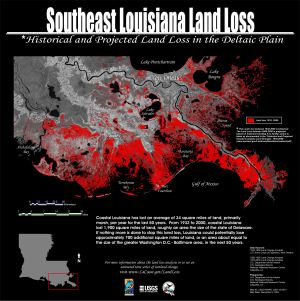
Land loss map of South Louisiana. Image source here. Click on image to enlarge.
Is it the weather? No fewer than three long, detailed and well-researched articles in important media discussed the continuing story of increasing land loss in South Louisiana. The Globe and Mail’s Omar el Akkad wrote an insightful piece about disappearing Louisiana in the October 18 paper. The October 5 New York Times Magazine’s main article was a heart-sinking rendering of the fight of a few individuals against the sheer unwillingness of anyone to do anything to save the State of Louisiana. The New Republic Magazine ran an article on September 30. The latter two articles particularly focused on corruption.
All three articles were excellent, so why should I want to add anything?
I am a sedimentary geologist. I worked for…
View original post 1,181 more words
Posted in Uncategorized
Leave a comment
Why I haven’t blogged for a long time: medical science and society in #Canada
Four months since my last post and only one person has wondered why I haven’t blogged in such a long time. Apparently I am not much missed, something that shouldn’t surprise anyone in this digital world of fleeting contacts. But I’m back. I am updating this post tonight and will resume my earth science blogging activities.
So what happened?
On March 31 of this year my husband suffered a small heart attack. He is in his mid 70s. He had a small heart attack 18 years ago after which he underwent heart catheterization, from which it appeared that there was little or no damage to the heart. At the time he was in a stressful job. He was put on a blood thinner (aspirin) and did a stress test each year which never gave any reason for concern. He was prescribed cholesterol medication for a mildly elevated cholesterol a few years later. He was always physically fit and didn’t smoke. He quit the stressful job almost instantly and retired 6 years later. Since that time, he kept up his fitness through regular walking, swimming and bicycling. We have disgustingly healthy eating habits and live a happy life.
So we were surprised when it happened this time. Surprised and a little angry: how can you get a heart attack when you live so healthy and are so happy? The cardiologist in the local hospital told us that my husband simply wouldn’t have lived this long if he didn’t have these very healthy habits. He did a couple of tests and determined the need for a heart catheterization, after which he expected that a balloon and stent procedure would solve the problem.
These procedures take place in the heart centre in the city hospital. A week later, my husband underwent the procedure. Surprise number two: his arteries were toast. There was nothing to send a balloon-and-stent through. He needed triple bypass surgery. We were shocked and scared, but were assured that this was routine surgery and that he was an excellent candidate for the surgery given his good physical condition and the good condition of his hear. The heart clinic has an excellent reputation and his surgeon would be one of the best of the clinic.
The bypass surgery took place nearly a week later, two weeks after the heart attack. By this time, he had been in hospital for about two weeks. Despite having walked around as much as possible, he had of course been rather inactive and had also been on a significant dose of blood thinners. As the surgeon said later: “that is excellent medication, but when we do surgery, it becomes our enemy”.
Then he drew the short straw: as the heart was lifted from the chest cavity to remove and replace the arteries, there was “a tear” at the back of the heart where it is attached to the back of the chest wall by membranes (if a medical person reads this and concludes this is not the proper way to describe it, please correct me). And since the heart is a vascular organ, full of blood, the flood gates opened: bleeding, serious bleeding. Instead of 5 or 6 hours, the surgery lasted 9 hours (yes, I had a friend with me during that agonizing wait). Nine hours on the heart-lung machine: the heart is stopped, the lungs are collapsed and the blood runs through the medical equivalent of a sewage treatment system, getting supplied with enough oxygen.
After nine hours, the sternum having been wired together again, he was moved to the Intensive Care Unit and we got to see him briefly. Of course, he was still sedated, intubated and mechanically ventilated. His hands were swollen, the skin tight. It was scary and very emotional. We went home, it was 1:30 am.
Three hours later (no, I had not been able to sleep) my phone rang: “your husband has to go back”. Go back? What does that mean? The only thing I managed to say was “should I come?”. The kind person asked me where I was: in the house of friends, not 10 minutes from the hospital. “you should get some sleep, we will call you”. Well, I didn’t sleep, of course and at 9 am, my phone rang again, he was back in the ICU. When I went to the hospital, I was told that they had to bring him back in because there was too much bleeding for the regular wound drain (so yes, the wires in the sternum were loosened again, he was opened up, back on the heart-lung machine). At this time, I didn’t know yet about the tear, I just knew there was ‘bleeding’.
He stayed sedated and ventilated another 24 hours and was then allowed to wake, but still ventilated. So he couldn’t speak, but he could squeeze my hand. Mostly he slept. The next day they removed the tubes, but he struggled to re-inflate his lungs properly: he was too weak to do it himself. Another day later he was again intubated and put on the ventilator. By this time he had not eaten anything in nearly a week. I was assured “his digestive system doesn’t need it, he gets nutrients via the drips”. But the ventilation was torture: his mouth was unbearably dry, but he was so confused that he refused the sponge to help moisturize him and the confusion (and frustration, I assume) made him aggressive, so they actually had to restrain him. It was terrible. He only left the ICU a week after the surgery and I had barely exchanged a word with him then.
During the next week he was in the ‘step down unit’, where the care is somewhat less intensive. They made him sit in a chair, where he would consistently fall asleep immediately. They tried to convince him to eat, they tried to feed him, but next to nothing went or stayed in. They began to try to walk him, but his legs simply buckled. He couldn’t keep his eyes open for more than a half a minute, he was confused (at one point he thought he was part of a movie set), he had no energy. Not until nearly two weeks after the surgery did he first speak a few lucid sentences (this for a man who is brainy). It was a scary period.
Three weeks after the surgery, he was allowed to be transported back to the local hospital, where he stayed another two weeks. All this time, I tried to get him to eat healthy food. Hospital food is terrible but I don’t blame the hospitals. The majority of patients isn’t used to healthy and wholesome food and many patients have difficult dietary restrictions. Thankfully, hospitals have patient kitchens. I have never spent so much time trying to prepare food that I would hope he would like (under normal circumstances, he is a good cook and does a lot of it) but most of the time, it went uneaten. He had no appetite and the thought of food revolted him. He had no energy to read or talk, he slept – most of the time.
He finally came home four and a half weeks after the surgery. He could only walk 50 meters, he still barely ate. He was completely deconditioned: his muscles had atrophied. I had rented a hospital bed and put it in my study. That was a life saver: he needed the height, he needed to adjust his position frequently, and I don’t think I would have been able to sleep next to someone in his condition.
That was two months ago. He now walks 2 kilometers each day and eats normally again. The hospital bed was here three weeks. The first few weeks I walked with him twice a day up and down the sidewalk. I pushed a borrowed walker, which he didn’t use, but he used it as a seat at the turnaround point or at any other point in time when he felt exhausted, which was often. Getting dressed was a major exercise. Taking a shower was the equivalent of running a marathon: he needed a serious rest afterwards. Fortunately, our house is ideal: a former bungalow, we kept our bedroom on the main (ground) floor after the renovation more than a decade ago. He has a studio (he is a photographer) also at ground level so no matter where he was, he didn’t feel isolated in an upstairs bedroom. Our house has an amazing view, which is nothing but therapeutic.
I read a lot about our “failing health system”. We didn’t experience anything as ‘failure’. The specialists (cardiologist, cardiac surgeon, residents) were expert and their communication skills were excellent. The nurses and physiotherapists were nothing but amazing: helpful, always there, always friendly (even when he was growling and angry and confused and frustrated), ready to talk to me at any time of the day or night. The pharmacists had all the time for our questions. The family doctor sees us regularly and takes his time, never rushing us out. And – this is Canada: we haven’t seen a single bill. We pay taxes, we don’t mind.
Posted in Uncategorized
1 Comment
Wrong Question: can fracking be done safely?
I published this post in February 2013. I have continued to add material to it, so the most recent bits of info are at the top of the page: scroll down for the original, which hasn’t been changed.
February 12, 2015
Dr. David Wheeler (president of Cape Breton University), who headed the Nova Scotia (government-appointed) panel on hydraulic fracturing in 2013-2014, gave an excellent speech to the Maritimes Energy Association. It’s an overview of our current and future energy needs and a plea for a Carbon Tax. He published it on his blog: Embracing a new energy future for Atlantic Canada”. Read it!
January 23, 2015
The King’s County Register published my letter about fracking (in Nova Scotia). Read it here.
Ten days after its publication, I received an envelope in the mail, i.e. it was sent to my home address by regular snail mail. There was no return address. The envelope…
View original post 1,031 more words
Posted in Uncategorized
Leave a comment
Canadian Earth Science for @PMHarper 11 – Dino Hunt!
The preamble to this review series is here
Posted today, February 12, the 206th anniversary of Charles Darwin’s birth and just in time for tomorrow, another #FossilFriday and another day to watch Dino Hunt!
—–
Bramble, K., M.E. Burns and P.J. Currie, 2014, Enhancing bonebed mapping with GIS technology using the Danek Bonebed (Upper Cretaceous Horseshoe Canyon
Formation, Edmonton, Alberta, Canada) as a case study. Canadian Journal of Earth Sciences, v. 51, p. 987–991.
Cover of the December 2014 special issue of the Canadian Journal of Earth Sciences, dedicated entirely to the Danek bonebed.
If you live in Canada and have TV, you should watch it: Dino Hunt! Every Friday evening at 9 pm Eastern, that is – if your cable provider has the History Canada channel (I bet 24 Sussex Drive in Ottawa does). Whether you do or do not have TV, check out the Dino Hunt website, as it is chock full of fascinating information and you get to meet Canada’s dinosaur hunters, i.e. paleontologists.
Earth Scientists owe a lot to Michael Crichton for penning “Jurassic Park” in 1990 and subsequently to Steven Spielberg for making the movie in 1993. The popularity of dinosaurs, already substantial, instantly skyrocketed and continues to do so. At least that aspect of earth science can bask in a reasonable amount of public interest and understanding. And who wouldn’t be awe-inspired by these magnificent beasts that once roamed our planet in great hordes only to become extinct suddenly, most likely after a 10km-diameter asteroid slammed into what is now Mexico’s Yucatan Peninsula?
For a good 200 million years, from about 220 to 65 million years ago, they were the dominant land animals on our planet. With the exception of the feathered Theropods, which evolved into birds as we know them today, all dinosaur families went extinct on that fatal day 65 million years ago.

Dinosaur evolution and demise. Image source here.
Canada has world class dinosaur fossil sites. Most sites are in Alberta, but there are also sites in Saskatchewan, British Columbia and Nova Scotia. Dinosaur Provincial Park in Alberta is one of Canada’s 17 UNESCO World Heritage sites. Close by is the Royal Tyrrell Museum, which hosts magnificent dinosaur displays and also functions as a research centre. The small community of Tumbler Ridge, British Columbia acquired Global Geopark status last year because of its rich diversity and extent of dinosaur trackways (see my earlier post on Canada’s Geoheritage here) and the world’s oldest (and tiniest) dinosaurs are found near Parrsboro, Nova Scotia, where the Fundy Geological Museum does them justice.
And then there is the Danek Bonebed, smack in the middle of the city of Edmonton. It was discovered in 1989 by an amateur fossil collector, initially excavated by the Tyrrell Museum and closed up again in 1991. It was reopened in 2006 by the University of Alberta’s Laboratory for Vertebrate Paleontology, which is led by world-famous paleontologist Dr. Phil Currie, who is part of the department of Biology (paleontology straddles the earth and life sciences and you might therefore find academic paleontologists in both biology and geology departments). The “Currie-stable” (if I may) has produced and continues to produce highly respected paleontologists, several of whom also feature on Dino Hunt.
What is special about the Danek bonebed is that is serves as the basis for a University field course, as a citizen science program (more than 4000 hours of volunteer service have been donated to its excavation) and as a prime public education site as well as an ongoing research location.

Location of the Danek bonebed, exposed in a creek that is part of the Mactaggart Sanctuary in the city of Edmonton.
The Danek bonebed is the subject of the December 2014 special issue of the Canadian Journal of Earth Sciences. There are 12 articles in this volume. Its title is the same as that of the introductory article by the issue’s editors, which I cite below.
So I had 12 articles to choose from! Why did I pick this one? Two reasons:
1. this paper is a perfect demonstration of how the daily practice of science is often mind-crushingly boring. Paleontology is about collecting. In order for a collection to be worth anything to proper and further investigation, in a manner that will make it a worthwhile to the global understanding of evolution, the collected bits must be catalogued and documented in great detail. Where was this little bone found exactly? What number does it get? What sort of a bone is it? What species did it belong to (ok, they know that here, because almost all of the bones in the Danek bonebed belong to Edmontosaurus regalis individuals, but still)? Talk about tedious. All in the name of science.
1. The paper reminded me of an important learning moment in my own experience: some 25 years ago, the office next to me was occupied by a PhD student in vertebrate paleontology. His subject was a cave on the island of Sardinia, on the floor of which were thousands of antelope bones. The question was whether those antelopes died a natural death or whether early humans used the cave as a place to deposit their hunting caches. How would one be able to tell? The student had mapped the bones on the cave floor in great detail and then sought help from geophysicists. Geophysicists were then just beginning to write programming that would enable recognition of patterns on seemingly chaotic seismic lines. This programming was applied to the antelope bonebed to find out whether its bone distribution was random (i.e. the result of a mass dying of natural causes) or – in some way – orderly (i.e. the result of humans depositing bones). To be honest, I don’t know what the outcome of that research was, but I have never forgotten how what was then brand new technology being developed for oil and gas exploration was applied to a completely different research question. That happens often, but it’s important to know that it does, in case someone has yet another cynical question about what this bit of academic research is actually good for?
The same is the case here. GIS technology (GIS stands for Geographic Information System), is information technology in a spatial context. The technology is less than 50 years old, was pioneered by British-Canadian Roger Tomlinson, and it continues to develop rapidly. It was designed for statistical mapping but quickly became used for investigating a plethora of other questions that require insight in spatial distribution of phenomena.
And so, after an immense amount of precise taxonomy and catalogueing, a researcher can open the Danek GIS-file, type in ‘femur’ in the search window and up pops the image below, highlighting every bone (within a precisely mapped quadrant) that is a femur. If the researcher then clicks on a particular femur, the database opens showing her all the parameters of that particular bone (length, amount of damage, from a juvenile or an adult, etc. etc.). This is an incredible tool for current and future researchers, a fantastic application of new technology in the still developing field of evolutionary biology = paleontology.
 An example of results if the researcher searches for ‘femur’ (bold black bones in the image). Figure 3 from the article by Bramble et al.
Early earth scientists, Charles Darwin among them, researched fossils intensely, making paleontology one of the corner stones of earth science. Nearly two hundred years later, the field is still developing rapidly using brand new technology and our understanding of evolution is growing with it.
—
Read more about the Danek bonebed here (by hip paleontologist Brian Switek), here (i-news), here (Canadian Geographic), here (the blog page of Canadien Science Publishing), and here (Geology Page)
References
Burns, M.E., C. Coy, V.M. Arbour, P.J. Currie and E.B. Koppelhus, 2014, The Danek Edmontosaurus Bonebed: new insights on the systematics, biogeography, and paleoecology of Late Cretaceous dinosaur communities. Canadian Journal of Earth Sciences, v. 51, p. v-vii.
Extreme tides and Winter ice
 Figure 1. Winter ice on the salt marshes of Minas Basin photographed from Wolfville, Nova Scotia, March 1, 2007. View to the North.
What is an estuary? An estuary is a bay with an open connection to the sea. Rivers flow into an estuary, mixing with sea water, resulting in a brackish water environment. All estuaries that we see today came into existence after the rapid sea level rise that marked the end of the last ice age ca. 12,000 years ago. If sea level stays stable long enough, estuaries eventually completely fill with sediment (pushing the shoreline seaward). There is ample evidence of filled estuarine sedimentary sequences in the geologic record and while they all share commonalities, they are also all unique and different from each other because the local conditions were different at their time of formation.
In our present-day world, estuaries are important habitats. Healthy estuaries are surrounded by tidal marshes, the extent of which depend on the estuary’s tide range. Tidal marshes generate lots of primary nutrients, mostly carbon (from marsh vegetation and dead critters), upon which feed fish larvae and other creatures all the way up the food chain. Estuaries are fertile places and therefore people like to live around them.
What I want to show you are some of the utterly amazing features of the estuary in my back yard: Minas Basin, an arm of the Bay of Fundy, boasting the highest tide range in the world, up to 18 meters between high and low tide. And despite being located at 45N, Minas Basin also experiences really serious winter ice conditions, which influence its sediment and nutrient balance. The estuary is bordered by soft shale and sandstone cliffs, which erode rapidly under the attack of tides and winter ice. The land surface is otherwise covered in thick, soft and easily erodible glacial deposits. The only other estuary in the whole world that compares somewhat with Minas Basin is Knik Arm, Alaska. So they are both pretty unique.
In early 2007, I collected some data for a sedimentary geology class I was teaching and we did an overflight with a small aircraft on what turned out to be the day of maximum ice extent in Minas Basin. It also turned out to be the day after the astronauts on the International Space Station took a picture of our part of the world. Two lucky coincidences:

Figure 2. The upper Bay of Fundy photographed by astronauts in the International Space Station on Feb 28, 2007 (image source here). Inset: Bay of Fundy and its tide ranges in meters. The red square indicates the coverage of the ISS image. The white streaks in Minas Basin are ice rafts, stringing along on the outgoing currents (the image was taken 3 hours after high tide). Click on image to increase size.
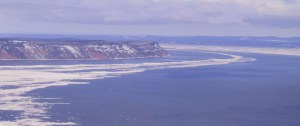
Figure 3. Ice rafts on the outgoing tide in Minas Basin, March 1, 2007, a day after the ISS image was taken. The headland in view is Cape Blomidon, the entry to Minas Basin is behind it. View to the NW. Photo taken from a small aircraft (that was a very cold flight!).
The Bay of Fundy itself almost never sees ice rafts, but its two extremities, Minas Basin and Cumberland Basin, generally see them every year. The reason is salinity. Minas Basin and Cumberland Basin are less saline than the Bay of Fundy itself because of the rivers flowing into them. Fresh water freezes at 0oC. Seawater, which has an average salinity of 35 ppm (parts per million), freezes at -2oC. That seems only a tiny difference but it makes for big differences in the field.
Let’s look at the system first:

Figure 4. Predicted day-time high tide range in Minas Basin for the year 2007 (there are two high tides per 25 hours, but for visual clarity, only the day-time high tide is included here). Vertical scale is in meters: zero is mean sea level. The horizontal scale represents the days of the year, all 365 of them. Note that there is a difference of about 9 meters between the lowest and the highest high tides during the year! The orange line indicates the approximate elevation of the high supratidal marsh. The blue accolade indicates the period of potential winter ice conditions. The extreme high tides bulges during the first and second half of the year are the months with perigean spring tides.
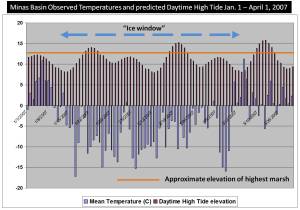
Figure 5. Observed mean temperatures (lower bars, data source here) and predicted day time high tide range for Minas Basin, March 1 through 31, 2007. Vertical scale of top half is in meters, vertical scale of bottom half is in degrees C. The “Ice Window”, i.e. the period during which ice rafts were able to form, lasted from mid January through mid March that year, but the high tide flooded the marsh only for a few days in late January and February. By late March, when the tides flooded the marshes again, most ice rafts had melted significantly.
When winter ice begins to form, it first forms closest to the shore on the marshes and on the edges of the tidal creeks near the river mouths, where the salinity is lowest (for simplicity sake, I’m ignoring supercooling here). Once a smaller ice raft is formed, it grows – with more ice, but also with frozen mud and dead vegetation. As the incoming tide floods the channels, ice is nudged up the sides of the tidal channels until the water starts spilling onto the marsh. The tide chart (Figure 4). shows that the marsh is rarely completely flooded: less than 10% of all the high tides in a year flood the marshes completely and some of those happen in winter (blue bracket on Figure 4).
Theoretically, at every higher high tide, the ice rafts are floated up further to the marsh interior but this works only for a limited time because the rafts become very heavy: they may contain as much as to 35% sediment by weight, as a result of which they become frozen to the marsh surface and so get stranded on the tidal creek edges, as can be seen in figures 6 and 7 below.

Figure 6. March 1, ’07: Ice blocks (dirty-ish blobs) concentrated on the edges of the tidal creeks as seen from a small aircraft. Width of view ca 200 m.
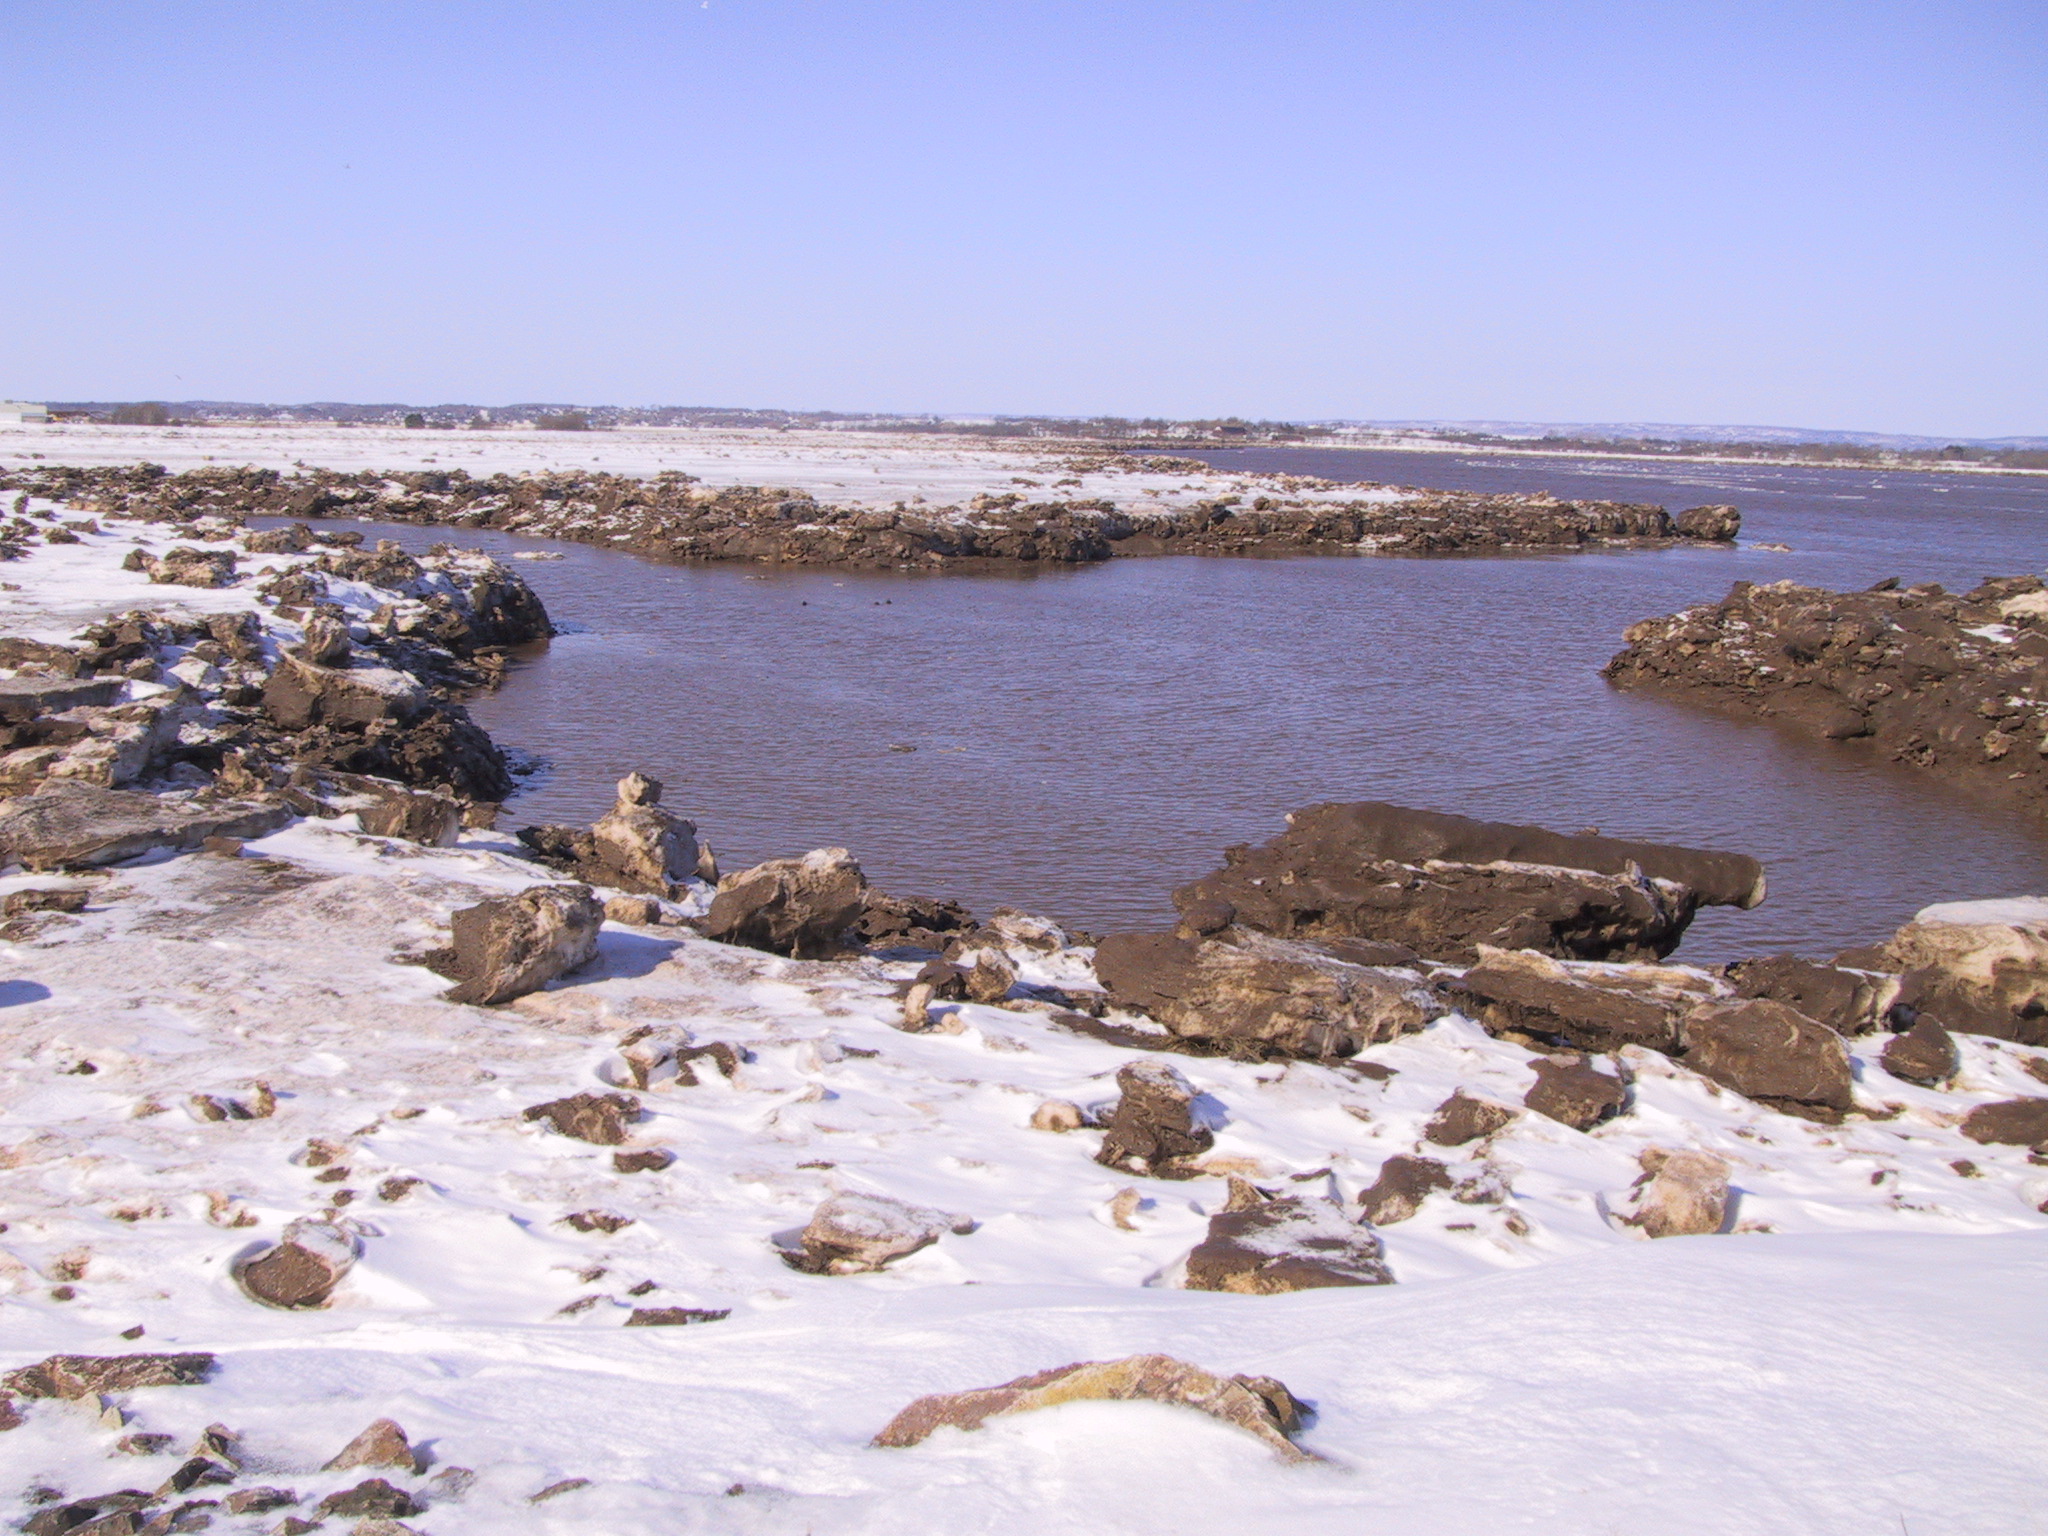
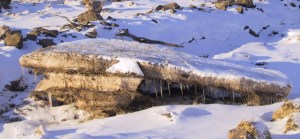
Figure 7. March 1, 2007. Left: ice blocks concentrated on the edges of the tidal creeks, same area as figure 6. Right: multigenerational ice raft incorporating sediment and dead vegetation.
Any ice that doesn’t freeze to the marsh surface, floats around on the tidal current and forms amazing patterns.

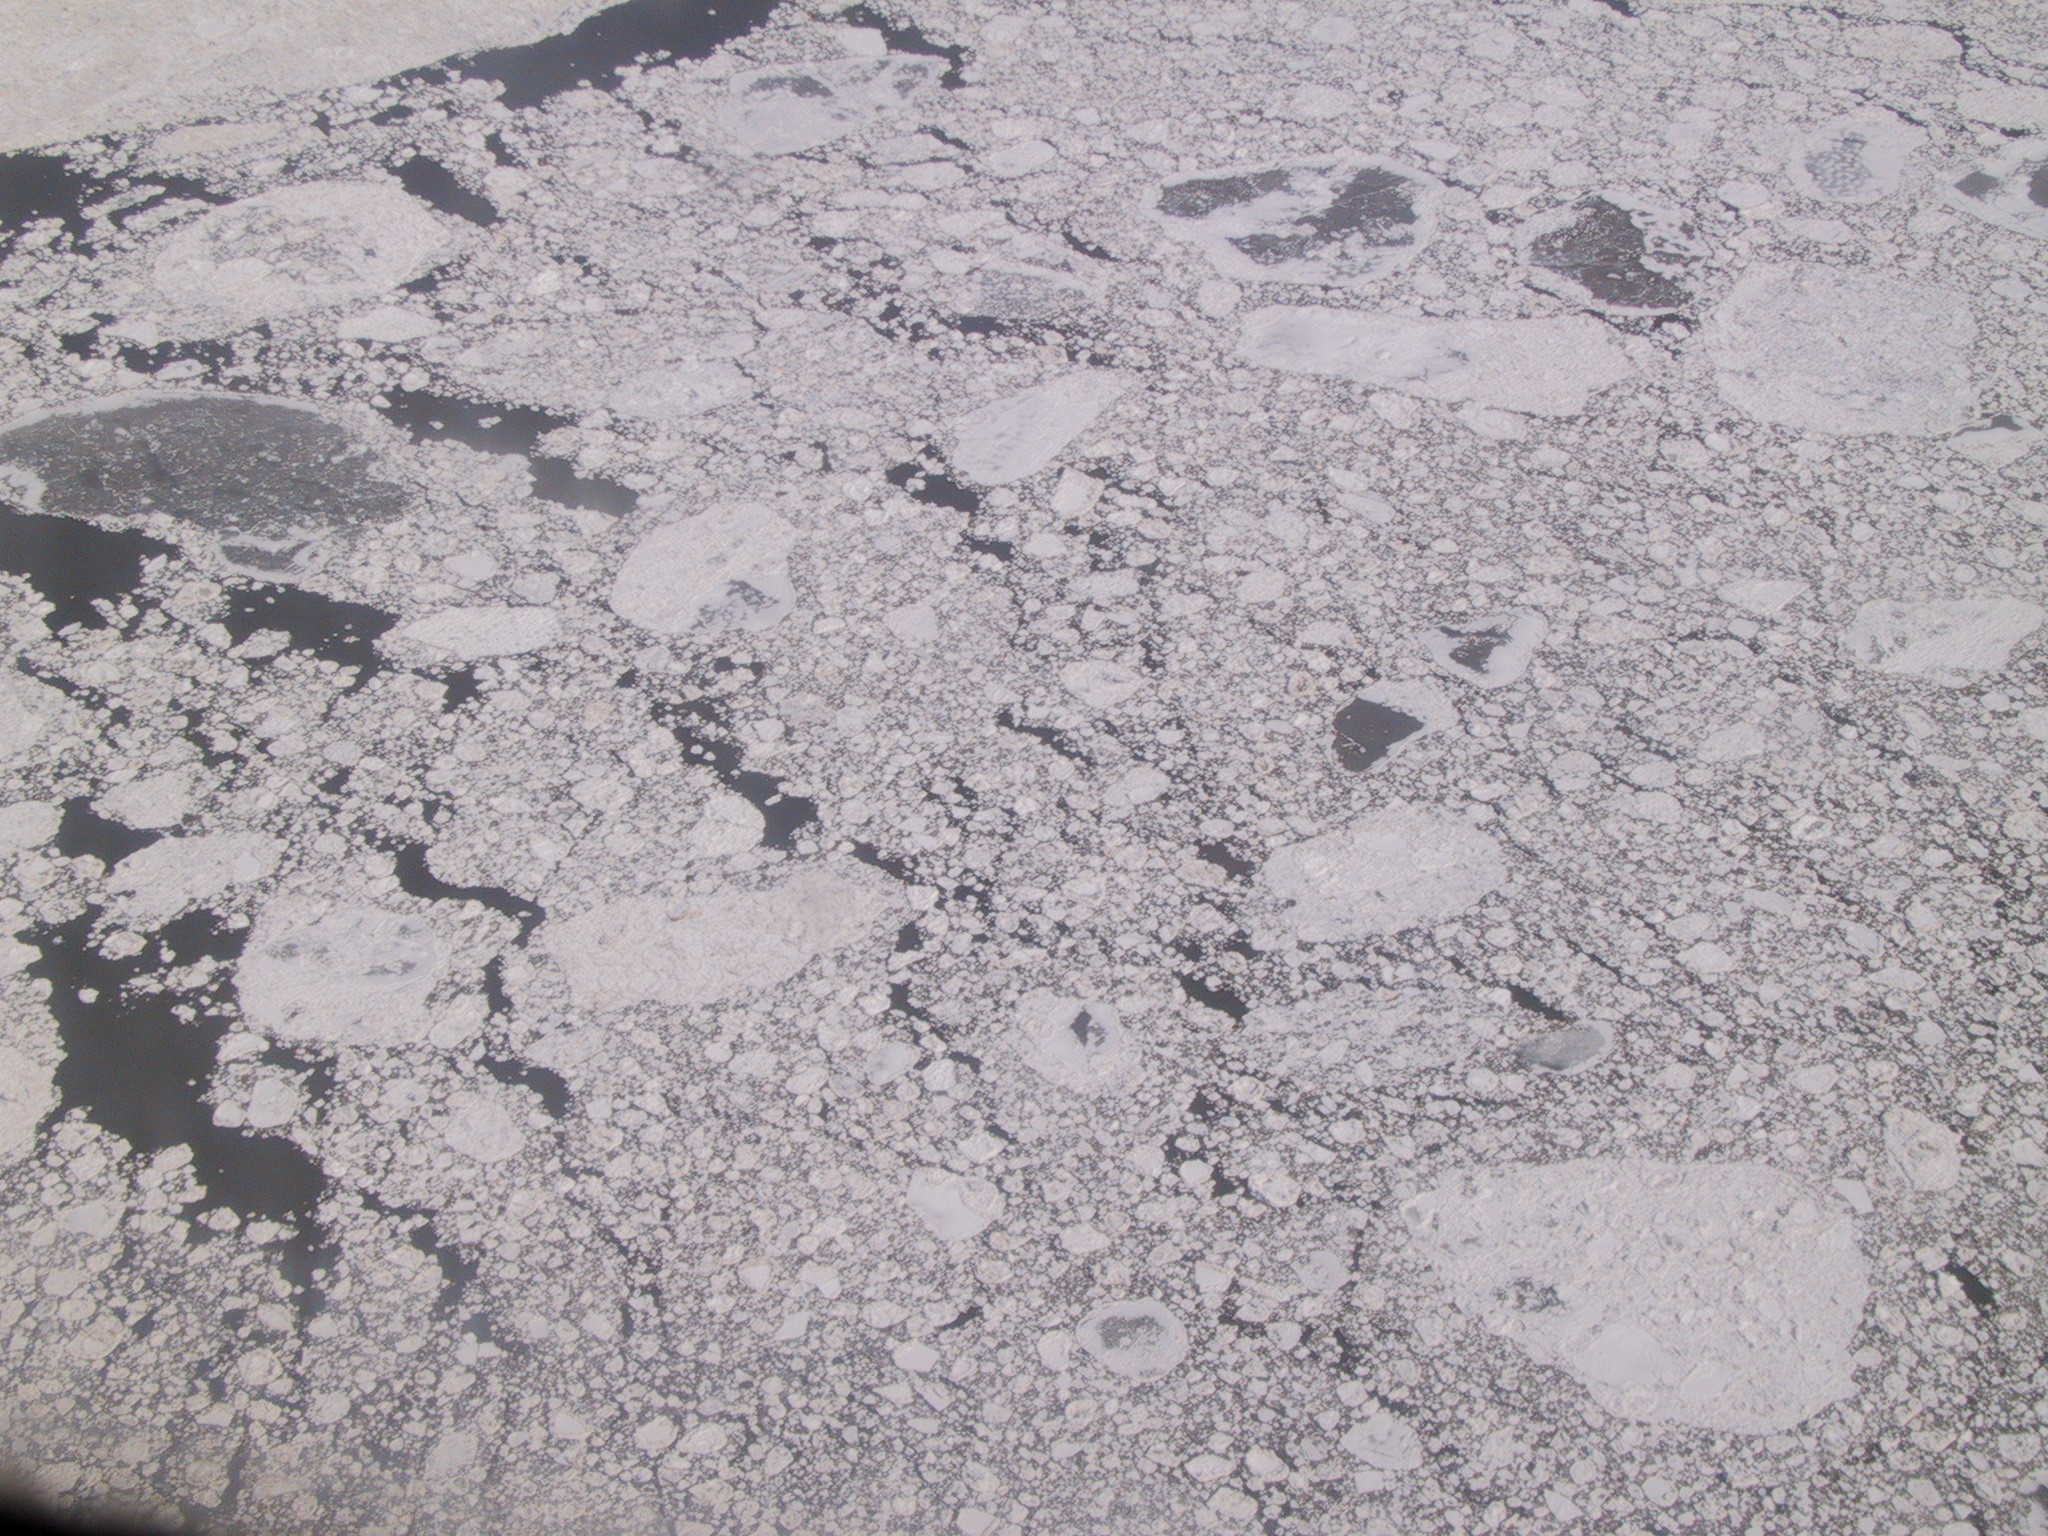
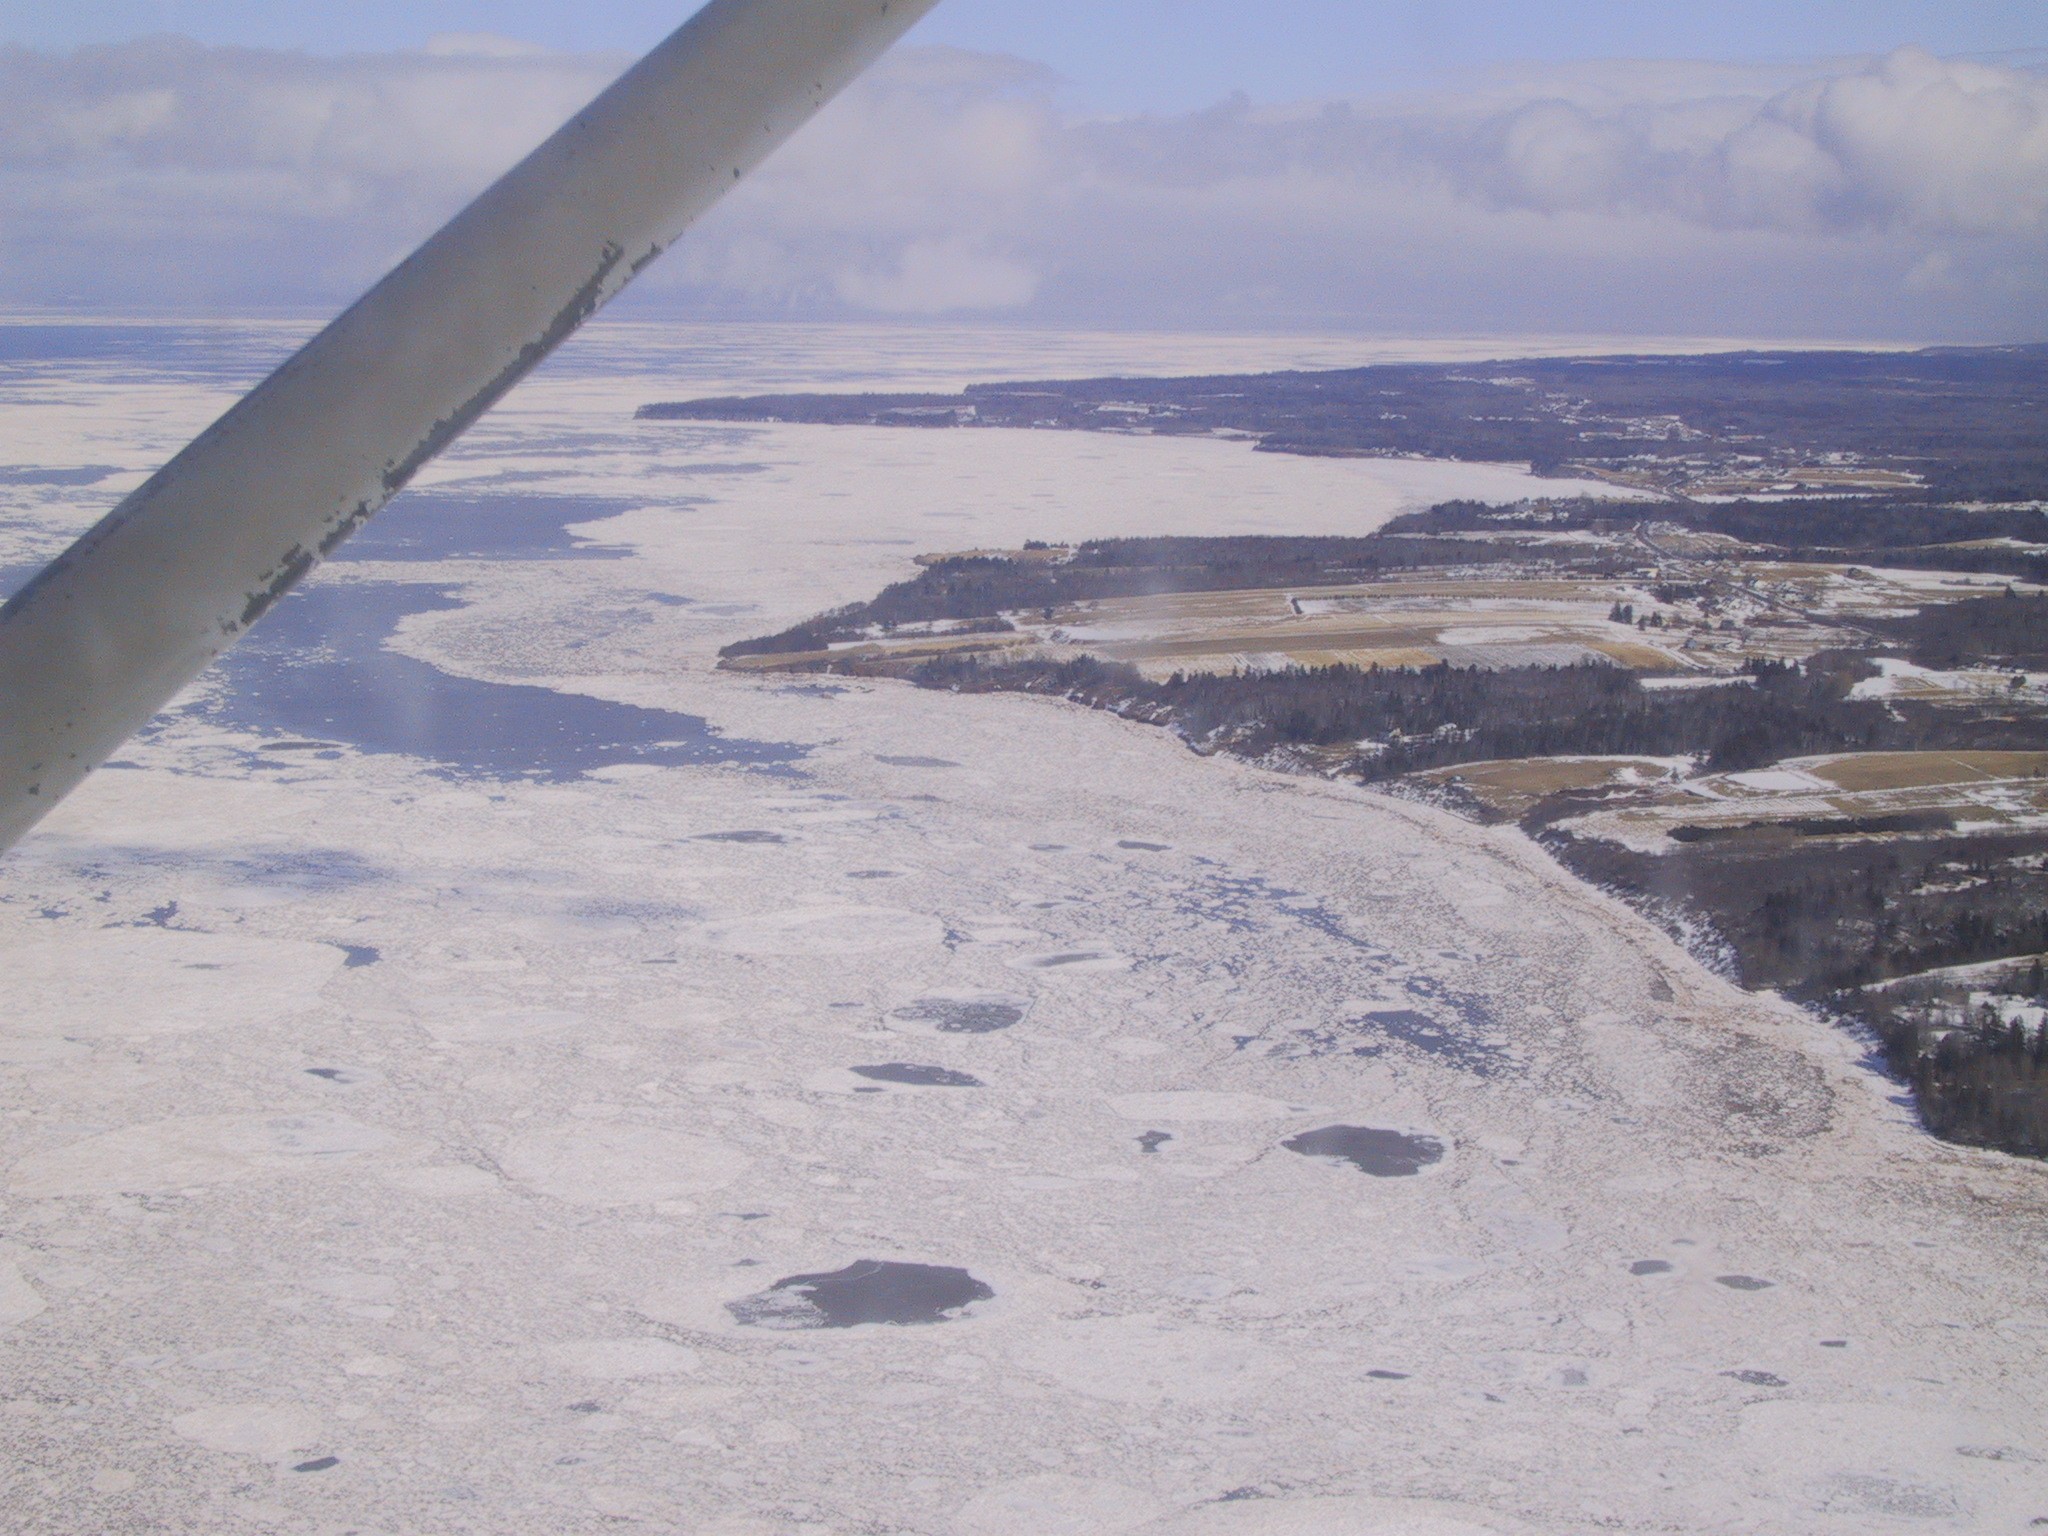
Figure 8. A variety of freely floating ice rafts in Minas Basin, March 1, 2007, as seen from a small aircraft.
By late March temperatures start to rise and the great melt begins. It may take up to two weeks for the big blocks to melt completely.
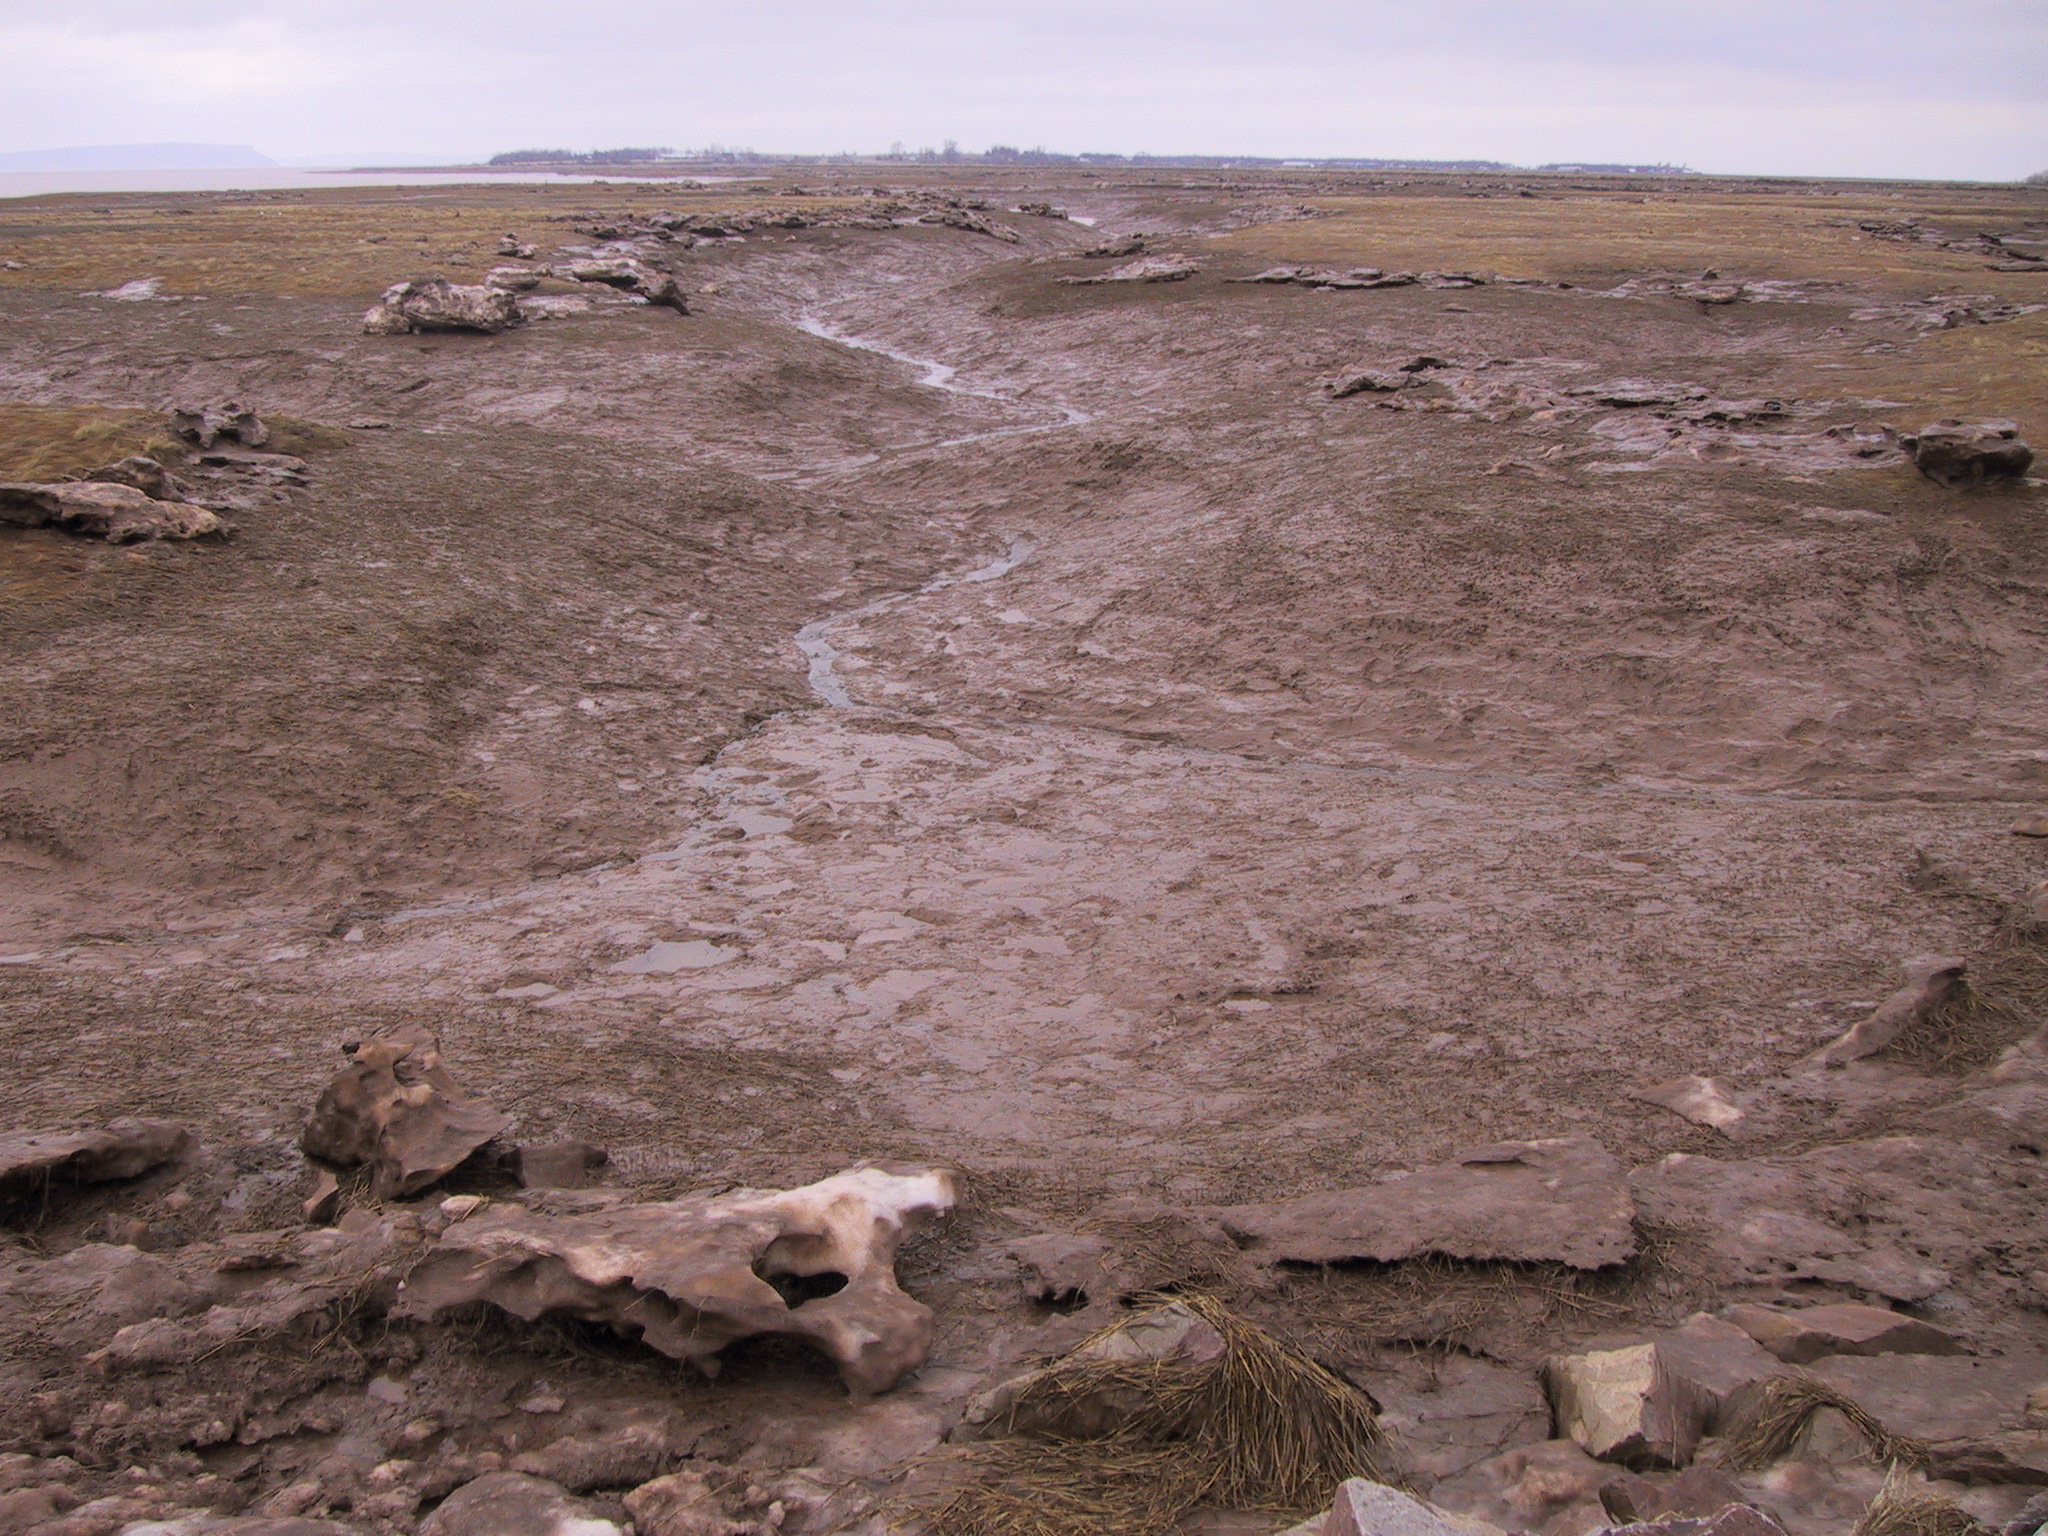

Figure 9. March 21, 2007. The average temperature had been above freezing for more than a week (see Figure 5). Left: Tidal channels with (slowly) melting ice blocks all situated on the channel edges. Right: what remained of one ice block: mud
So here is the interesting question: how much do the typical winter ice conditions contribute to the sediment budget so that the marsh can maintain elevation at Mean High Water level? To what extent owe tidal creeks their stability to their banks being frozen solid for 2 months?
Are these questions relevant? Yes, they are: tidal power generation is coming our way (see my earlier post on Nova Scotia tidal power development here) and without better numbers, modeling the effects of large-scale tidal power on the estuary remains guesswork. Ice is a concern for tidal power generation because of the possibility that heavy sediment-laden ice rafts may become detached from the marsh, barrel through the water below the surface and become cannonballs for tidal turbines. The Nova Scotia government commissioned a study on winter ice conditions about 10 years ago (Saunders and Baddour, 2006) but luck had it that 2005-6 was a winter without any ice, so these authors had to rely on literature.
A lot of excellent research on sediment budgets and marsh dynamics is carried out, notably by Dr. Paul Hill, Dr. Danika van Proosdij, and Dr. Brent Law, but winter ice is difficult to research because unpredictable and while they both acknowledge the importance, they haven’t been able to turn their attention to it yet as much as they would like.
Stay tuned.
February 10: My local paper retold a favourite ice raft Valentine’s Day folklore tale this week. Read it here
References
Desplanques, C. and D.J. Mossman, 2004, Tides and their seminal impact on the geology, geography, history, and socio-economics of the Bay of Fundy, eastern Canada. Atlantic Geology, v. 40, p. 1-130
Kosters, E.C., 2007 (abstract), Tides, Sediment and Ice: wreaking havoc with in stream tidal power development in Minas Basin? Program and Abstracts, Atlantic Canada Coastal and Estuarine Science, Society Conference, Sydney, NS.
van Proosdij, D., Milligan, T., Bugden, G. and C. Butler, 2009, A tale of two macrotidal estuaries: different morphodynamic response of the intertidal zone to causeway construction. Journal of Coastal Research, SI 56, 772-773. ISBN 0749-0258.
Sanders, R. and E. Baddour, 2006, Documenting Ice in the Bay of Fundy, Canada. National Research Council of Canada, Report no. CR 2006-01, 22 p + appendice
Posted in climate change, General geoscience, Minas Basin, Bay of Fundy, Nova Scotia
Tagged Atlantic, Canada, climate, Climate Change, coastal zone management, earth science, energy, environment, geology, geoscience, Ice Age, Minas Basin, Nova Scotia, oceanography, Quaternary, Science, Sea Level, sedimentology, tides
2 Comments
Canadian Earth Science for @PMHarper 10 – a question of Iron
The preamble to this review series is here
—–
Halverson, G.P., F. Poitrasson, P.E. Hoffman, A. Nédélec, J.-M. Montel and J. Kirby, 2011, Fe-isotope and trace element geochemistry of the Neoproterozoic syn-glacial Rapitan iron formation. Earth and Planetary Science Letters, v. 309, p. 100-112.
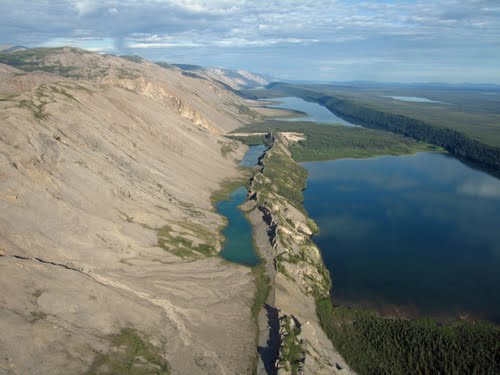
The MacKenzie Mountain front in Canada’s NW Territories as seen from the river plain near Norman Wells. Image from Google Earth (Panoramio). The fieldwork for this paper was carried out in these mountains.
Iron is Earth’s most common element by weight. There is so much of it that a compass needle (yes, also the one in your smartphone) lines up with the earth’s magnetic field. We also know that Iron changes form, because we are familiar with rust. Rust is oxidized iron and oxidation happens when Ferrous Iron (Fe2+) is exposed to the atmosphere (rich in oxygen) without being protected by some sort of coating. Under the burning influence of atmospheric oxygen,Ferrous Iron it changes to Ferric Iron (Fe3+) and turns red. A lot of rocks are rust-coloured because of this reason.
Iron also has one unstable isotope: 57Fe. The amount of this isotope varies every so slightly depending on oceanic and atmospheric chemistry. This change can tell us something about conditions in the past, if we know the age of the rocks. This article uses that knowledge to unravel conditions about 700 million years ago.
The authors of this article are Snowball Earth (official site here) experts: their research focuses on testing the hypothesis that earth around this time experienced a global ice age during which continental ice caps covered most of the planet as far as the equator.
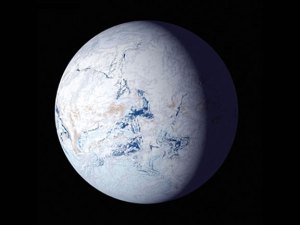 Artist impression of Snowball Earth
The most obvious evidence for Snowball Earth is the ubiquitous presence fossilized glacial till in rocks of this age. Till (another word is diamictite) is the chaotic sedimentary mass that forms beneath a continental ice cap: it consists of pulverized rocks and pebbles in hard clay. A dead give-away of a former ice cap over the ocean (such as Antarctica’s Ross Ice shelf today), is the presence of dropstones in marine sediments. Dropstones are rock fragments, eroded from underlying bedrock by the icecap, transported by that same ice cap and subsequently melted out, fallen to the sea floor below and incorporated in the sediment.
The authors of this paper studied a sequence of rocks known as the Rapitan Group in the Mackenzie mountains in the Northwest Territories (latitude 640N). The Rapitan Group is ca. 700 million years old and shows evidence of ice age conditions, such as till and dropstones. When these sediments were deposited, this part of earth was situated at about 180S! Not a latitude where glaciers occur today or in our more recent Ice Ages when they reached as far as about 400 (North or South).
Not only show the rocks of the Rapitan Group evidence of glacial conditions, they are also unusually enriched in Iron.
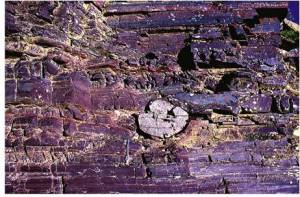
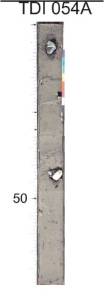
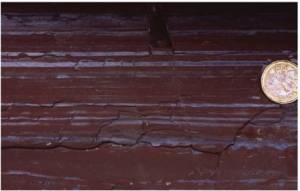
Left: A dropstone in iron-rich sediments of the 700 million year old Rapitan Group, Mackenzie mountains, NWT (pen for scale below the dropstone; photo from article). Centre: a core with 20,000 year old sediments and dropstones from the Orphan Basin offshore Newfoundland for comparison (vertical scale in centimeters) (Image Source Tripsanas et al, 2007). Right: finely laminated Iron-rich marine mudstones and siltstones from a different interval in the Rapitan Group.
Sedimentary rocks with this much Iron are called ‘Banded Iron Formations’ (BIF). The most widespread BIFs are much older, between 2.4 and 1.8 billion years and they represent the bulk of the world’s iron ore deposits. Those earlier BIFs are thought to have originated biologically: massive Iron fertilization of the world’s oceans through ocean floor vents caused equally massive blooming of cyanobacteria, which were almost the only living organism at the time, fixing the iron in these bacterial sedimentary rocks. In the course of that process, earth’s atmosphere got its first major oxygen injection because cyanobacteria are photosynthesizers (if you think this is one of these completely irrelevant ivory tower types of research, I’m happy to remind you of this ocean iron fertilization controversy).
But the BIFs of the Rapitan Group are different than those much older BIFs. The BIFs of the Rapitan Group were deposited in greater water depths and, unlike the older BIFs, their origin is linked to ice caps (dropstones and the like). Why suddenly all this iron-fixing again after it had ended 1 billion years earlier? Were Snowball Earth conditions the cause of this return of massive iron fixing?
After an immensely complex series of chemical analyses, the interpreted scenario is as follows:
Ice caps covered most of Earth during this time and the remaining ocean waters were cold. Iron was supplied to the oceans by interaction between ocean water and the ocean floor. Because ice covered most of the water surface, remaining ocean waters didn’t circulate or overturn much, so that any deeper ocean waters (just below the thin, oxygenated photic zone) were oxygen-deprived. The underside of the ice caps would nevertheless melt in contact with ocean water and send dropstones and occasional gravity flows (high density currents that hug the bottom) to greater depths, interfingering with the deeper finely laminated silts and muds.
The Iron that was released from the ocean floor precipitated either as a result of fixing by bacteria that thrived in low-oxygen conditions or as a result of abiologic oxidation: the research is inconclusive about which process was responsible.
The lower part of the Rapitan Group sequence is dominated by intervals that show finely laminated iron-rich mudstones and dropstone-dominated intervals. These were deposited and precipitated on the bottom of the sea under oxygen-poor conditions. The 57Fe isotope has low values. Upwards these abruptly make place for tills deposited below a continental ice cap and at this boundary the isotope 57Fe shows a marked increase, which must be explained by an increase in the amount available oxygen.
It’s difficult to interpret element cycling conditions on our planet this long ago because it was such a different place from today: bacteria were the only life forms, the land was barren. And yet the authors have found a modern analogue to the strange conditions that made deposition of the Rapitan Group rocks possible. The modern analogue is Lake Nyos, in Cameroon.
I was at work in the summer of 1986 when news spread that a volcanic eruption in Cameroon had killed nearly 2000 thousand people and a lot of cattle. A few days later (it was the pre-digital age), it turned out that this catastrophe had not been caused by a volcanic eruption. Lake Nyos is a deep crater lake of an inactive volcano. Because it is located in the seasonless tropics, the waters of this lake don’t overturn and hence the lake is anoxic and rich in carbon dioxide below the thin oxygen-rich surface layer. When a small landslide slid into the lake, oxygen-rich surface and anoxic deeper waters suddenly became mixed, allowing previously locked up toxic gases to escape over the crater edge and down the slope of the volcano (carbon dioxide is heavier than air and hugs the ground), suffocating people and cattle in its way. A unique and disturbing disaster (read more about it here).
In order to prevent such a catastrophe from happening again, the lake is now ventilated by a metal pipe through which deep water is pumped to the lake surface. The pipe delivers Ferrous Iron to the surface where it immediately oxidizes. At the anoxic-oxic boundary, the same change in 57Fe isotope is detected as in the Rapitan Group rocks. This observation strengthens the interpretation that conditions changed from anoxic to more oxygenated 700 million years ago.
 Lake Nyos being degassed. (Wikipedia)
This is challenging research. Not only does it require travel to the remote Mackenzie Mountains, where you must sample inaccessible sections of rocks and then store and transport the samples without polluting them, you must also carry out very complex chemical analyses. Samples were shipped all over the world to specialized laboratories. The authors go to great lengths to explain all the ifs and buts and potential pitfalls of this kind of work and how they avoided them. Hats off.
This paper is an elegant contribution to understanding the incredibly intricate and complex cycling of elements and nutrients on our planet over time. A small trigger suddenly caused the deposition of massive iron deposits during an utterly exotic global glaciation. Cause for reflection on our role as humans and the potential pitfalls of human intervention in system Earth.
Reference
Tripsanas, E.K., D.J.W. Piper and K.A. Jarrett, 2007, Logs of piston cores and interpreted high-resolution profiles, Orphan Basin. Geological Survey of Canada Open File 5299, 339 pages.
Nova Scotia’s own Great Unconformity

The Angular Unconformity (U) at Nova Scotia’s Rainy Cove, separating intensely folded and faulted early Carboniferous shales and sandstones of the Horton Group (labeled 1 below the unconformity) and gently inclined, undeformed sandstones and conglomerates of the Wolfville Formation (2) at Rainy Cove, Nova Scotia.
A New Year, a new blog banner! My banner pictures are from around Minas Basin, a stunning estuary on which shores I live (this to my daily surprise and gratitude). My previous banner picture and associated blog post is here.
—-
The unconformity in this banner photo is exposed along the eastern shores of Minas Basin (location image at the end of this post). It is one of my favourite places to explore along these shores: there is so much to see here! Not only in the exposed cliff face, but also on the tidal flats that extend for several kilometers west of the cliff for about 2 hours (during low tide).
Here are two close-ups of the dashing exuberance of rock units 1 and 2:
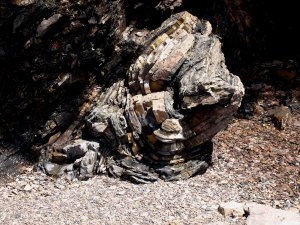
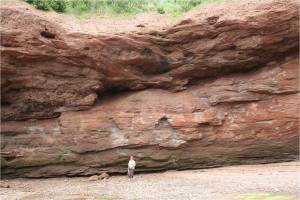
The contrast between the two units below and above the Unconformity at Rainy Cove. Left: intensely folded organic-rich shales and sandstones of the lower Carboniferous Horton Group (ca 340 million years old, unit ‘1’ in top photo). The image is about 2 x 2 meters. Right: massive, undeformed sandstones and conglomerates of the Wolfville Formation (unit ‘2’ in top photo – person for scale).
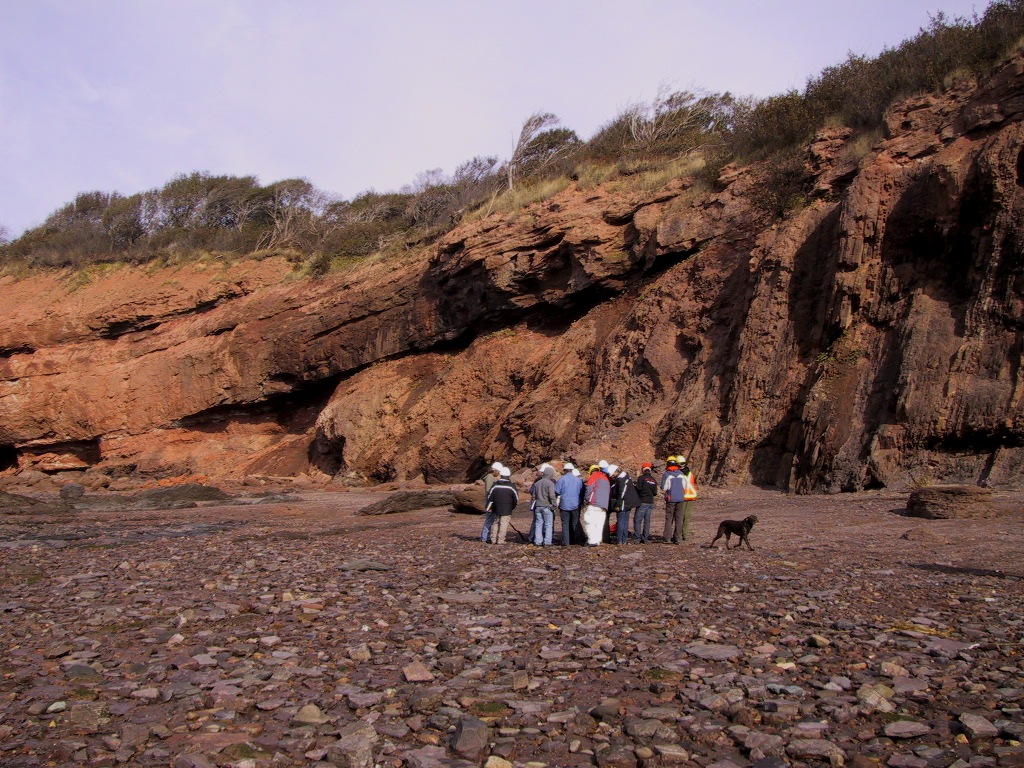
Close up of the Rainy Cove outcrop with the Angular Conformity
What is an unconformity, how does it come about and why is that interesting or even relevant? This is not an exhaustive coverage of the subject, so here I will discuss only the type of unconformity we see here, the “Angular Unconformity”.
Here is a schematic image of how such an angular unconformity is formed:
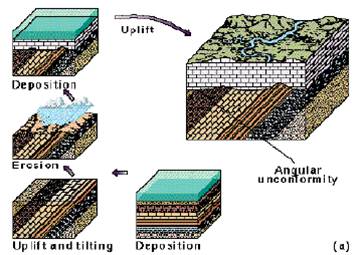
How an Angular Unconformity comes about (image source here). First (central panel, bottom of figure) sediments are deposited in a sea. The different colours and patterns indicate different kinds of sediments, such as sandstones and limestones. Next (lower left hand corner), the sediments, having become lithified, are uplifted and tilted during a mountain building episode. During and after uplift, the mountains are eroded down (central left hand panel) until the land surface is once again the bottom of a sea and new sediments are deposited on top (upper left hand panel). When those sediments are once again lithified and uplifted during a subsequent tectonic event, the end result is two juxtaposed rock formations, each with a different orientation (largest panel). There may be millions of years between the time of deposition of the first and the second set of rocks. The surface between the two formations (which shows as a line in a two-dimensional rock face) is the Angular Unconformity. The Angular Unconformity marks a gap in time from which rocks are missing at the outcrop.
So – what happened here in Nova Scotia? This is what happened:

A. During the early Carboniferous, about 340 million years ago, Nova Scotia (red star) was located in a southern tropical latitude. Rich tropical forests bordered a shallow tropical sea, which was becoming narrower as the continents fused together to form the supercontinent Pangea (the green star is where Nova Scotia is located today). Thick piles of sediments of what we now call the Horton Group, consisting of organic-rich shales and sandstones, rife with unique fossil assemblages (especially at Blue Beach and Joggins), were deposited during this time in the quickly opening Maritimes Basin (image adapted from The Last Billion Years).
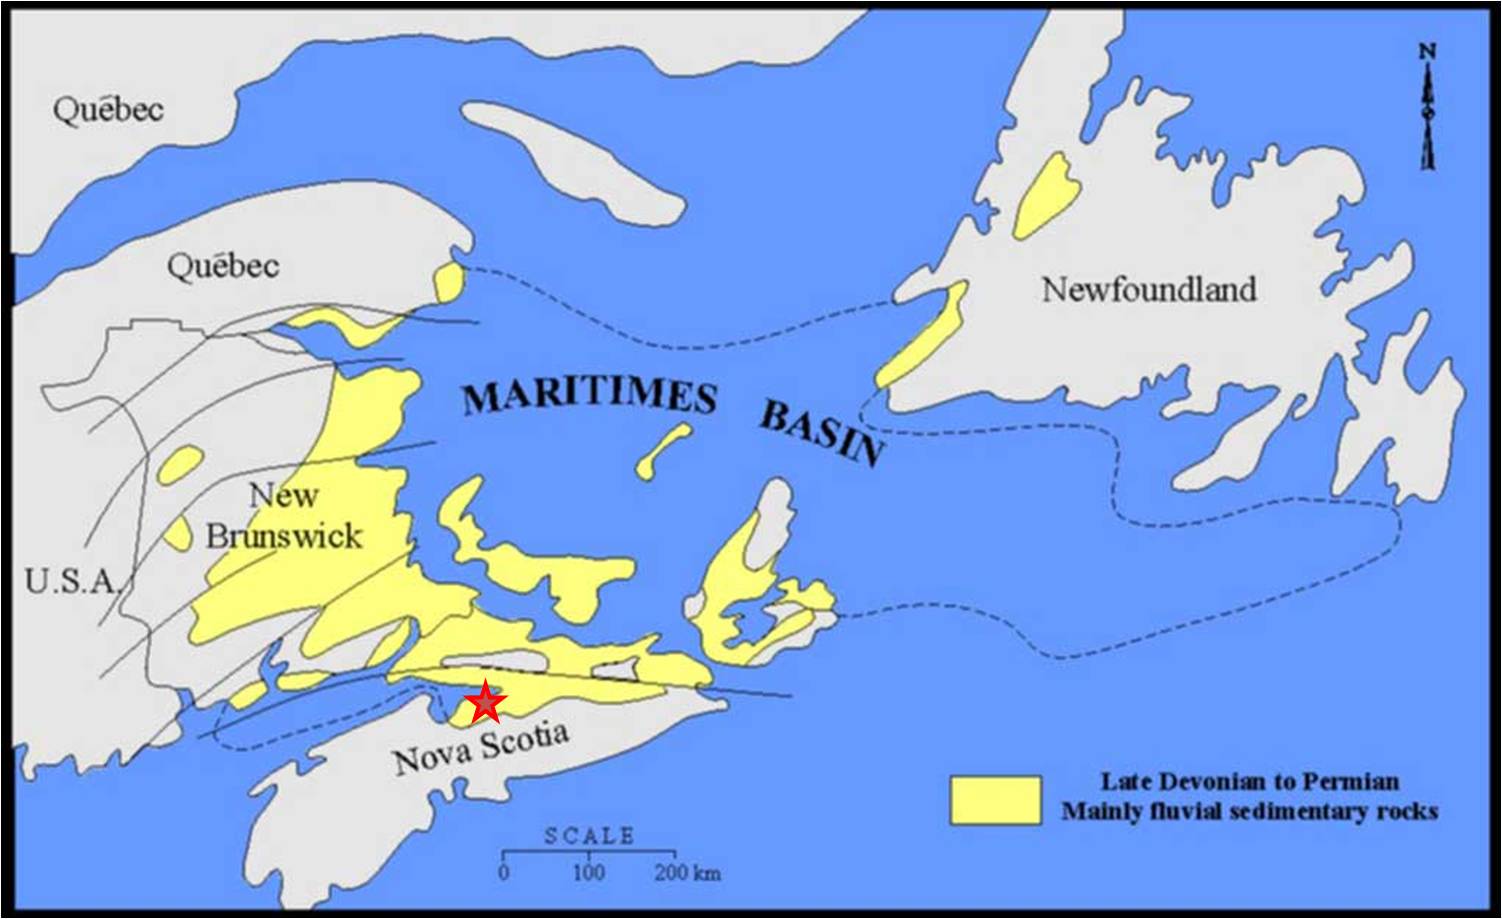
The Maritimes Basin. Rainy Cove is located at the Red Star.
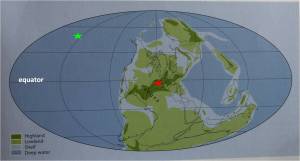
B. By the late Carboniferous, ca. 305 million years ago, Pangea had formed and the sediments from that shallow, tropical sea had become sedimentary rocks. They were folded and faulted during the Appalachian-Acadian mountain building episode. These mountains rose as a result of the collision of these continents. Note that Nova Scotia is now solidly at the Equator. Image adapted from The Last Billion Years.

C. By the Permian, about 255 million years ago, things look fairly similar to the late Carboniferous, but Nova Scotia has yet again moved further north. It is still ‘highland’ and is eroding and shedding sediment to regions further away. Image adapted from The Last Billion Years.
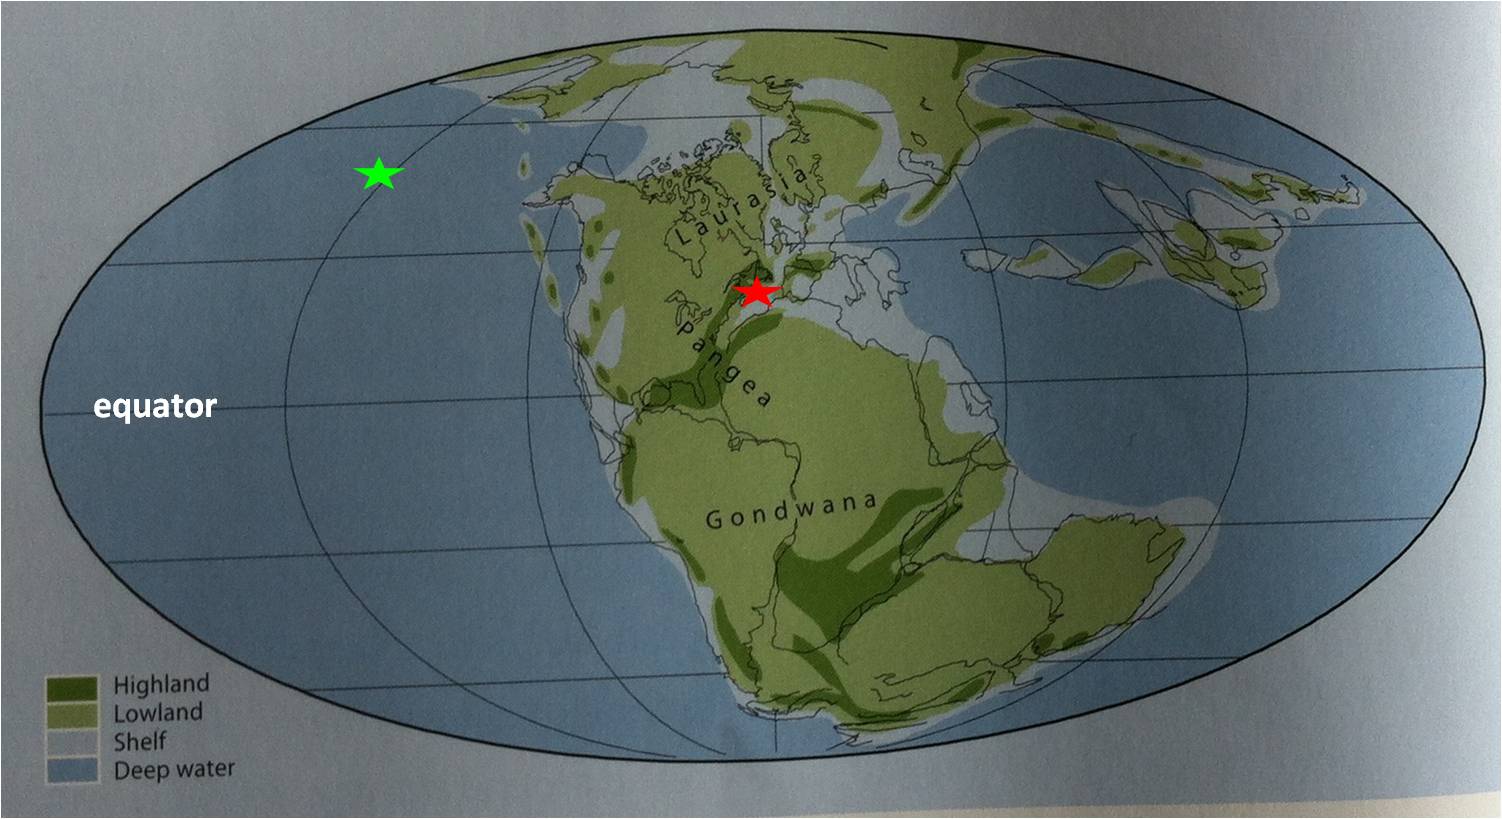
D. By the late Triassic, ca. 215 million years ago, a crack is appearing in Pangea because of early break-up of the supercontinent. This process will eventually lead to the formation of the Atlantic Ocean. Nova Scotia is now at 150 N, the latitude where deserts occur, just like today, because of rising air masses (the tropics are wet because of descending air masses, the latitudes above and below that experience rising air masses and are hence dry). The former highlands are eroding and massive amounts of sediment are sent into these opening rift portions as alluvial fans. These are the sedimentary rocks of the Wolfville Formation, which overly the unconformity (unit 2 in the top photo). Image adapted from The Last Billion Years.
The Angular Unconformity at Rainy Cove represents a gap in the geologic record, a period of ca. 135 million years. The early Carboniferous sediments were deposited ca. 340 million years ago, the late Triassic sediments ca 215 years ago: no rocks of 340-215 million years old are found here. Sediments of this time interval exist elsewhere: all of Prince Edward Island consists of Permian sedimentary rock (298-252 million years ago), deposited while sedimentation bypassed what is now Nova Scotia, which was being eroded and whittled down.
Now look again at the paleogeographic maps above. Opposite (future) Nova Scotia are NW Africa and SW Europe. This Carboniferous basin extended along the stitch line (called ‘suture zone’) of these colliding continents. When the future Atlantic Ocean started to form, rifting took place along some much older zones of weakness in the earth’s crust. There are very similar sequences on what is now the other side of the Atlantic Ocean. Here is an example in SW Portugal.
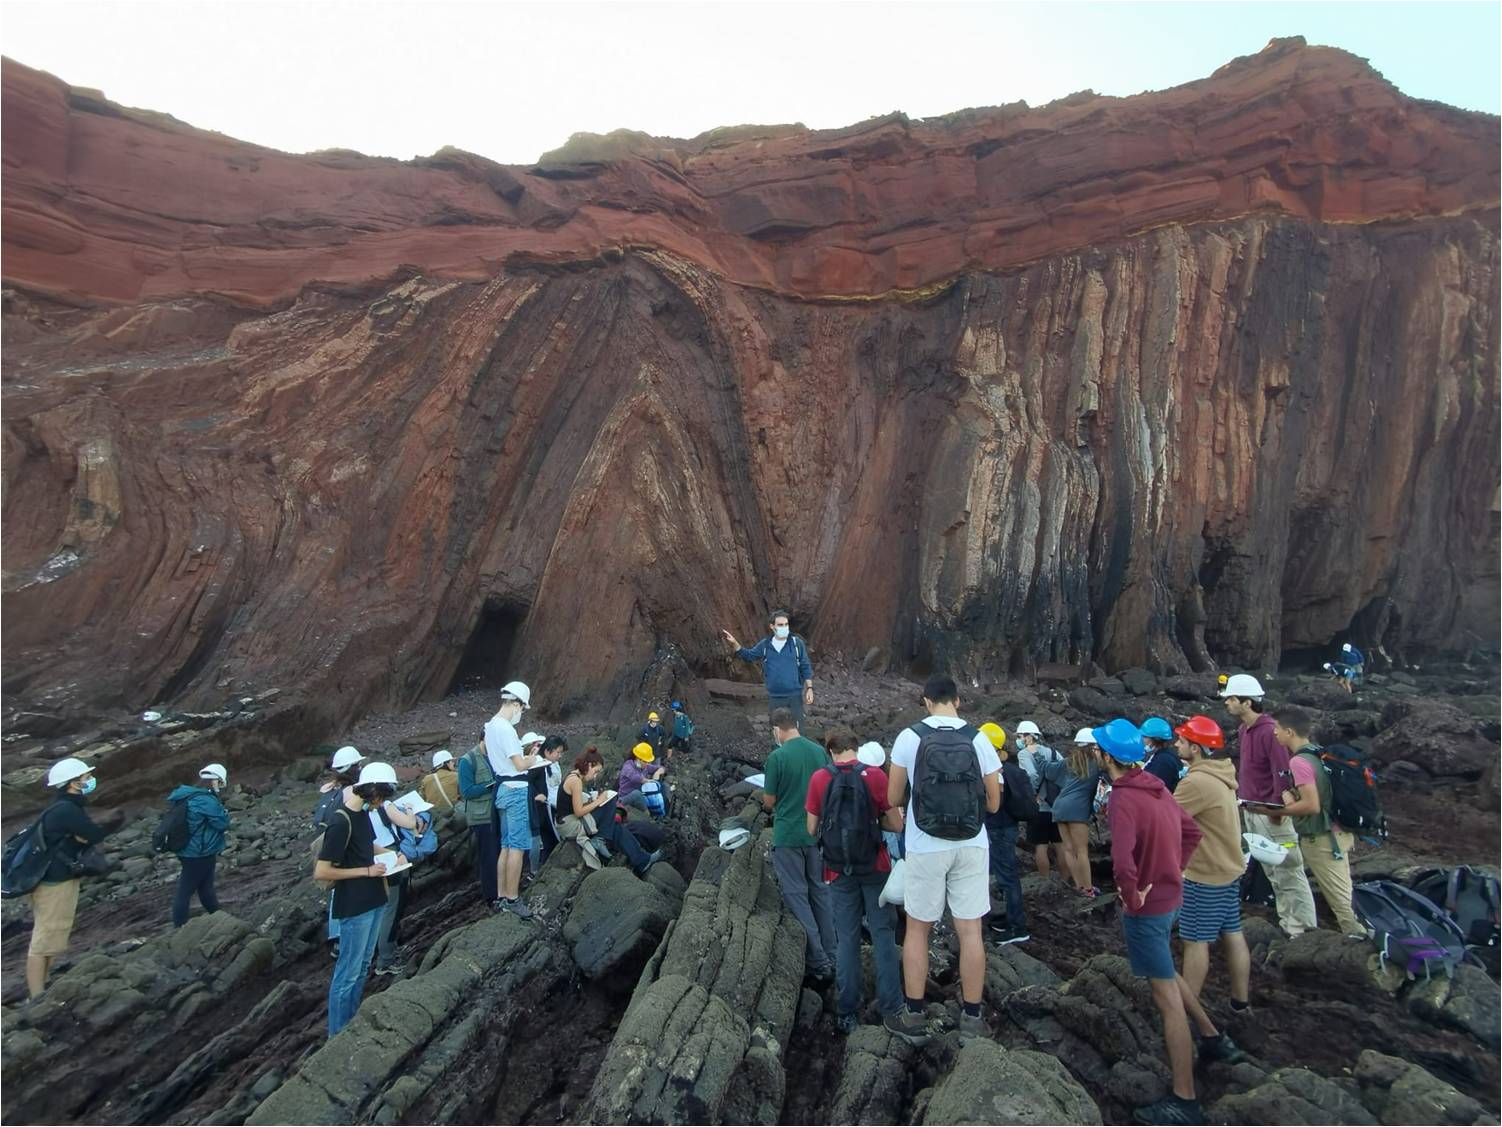
Carboniferous-Triassic Angular Unconformity at Telheiro Beach, SW Portugal. This sequence is identical to the one at Rainy Cove. Image by Joao Duarte (@JoaoCDuarte)
Why is this interesting or even relevant?
Reconstructing such large-scale processes helps us understand the evolution of the earth and its tectonic activity. These processes have not only contributed to what our landscape looks like, they also help us understand the occurrence of our own natural resources and those in other regions. Opening and closing of oceans and associated mountain building processes explain the occurrence of much of our earth resources. Outcrops such as these help us understand rocks in the subsurface too. For example, the article by Leleu et al, cited below, was the result of a study that looked at the Wolfville Formation as an analogue to hydrocarbon bearing rocks in the subsurface of the North Sea.
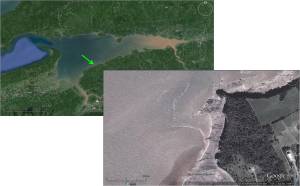
Minas Basin, Nova Scotia (images Google Earth). Left: overview image – the green arrow points to the location of Rainy Cove. Right: same image, zoomed in. The Rainy Cove outcrop runs more or less North-South. It’s early morning in this image because the cliff is in the shade. The tide is fairly high, because the tidal flats aren’t all the way exposed, but a portion of the rocky tidal flat is exposed, showing intricate structures in the exposed rocky beach.
References
Atlantic Geoscience Society, 2000, The Last Billion Years, A geological history of the Maritimes Provinces of Canada. Nimbus Publishing,
Leleu, S., X.M.T. van Lanen, and A.J. Hartley, 2010, Controls on the architecture of a Triassic sandy fluvial system, Wolfville Formation, Fundy Basin, Nova Scotia, Canada: implications for the interpretation and correlation of ancient fluvial successions. Journal of Sedimentary Research, v. 80, p. 867-883
Waldron, J.W.F., C. Roselli and S.K. Johnston, 2007, Transpressional structures on a Late Paleozoic intracontinental transform fault, Canadian Appalachians. Geological Society of London, Special Publications, v. 290, p. 367-385
2014 in review: my world according to WordPress
The WordPress.com stats helper monkeys prepared a 2014 annual report for this blog.

Here’s an excerpt:
A New York City subway train holds 1,200 people. This blog was viewed about 6,200 times in 2014. If it were a NYC subway train, it would take about 5 trips to carry that many people.
Posted in Uncategorized
Leave a comment
A #tsunami is really a tidal wave, except it isn’t

Katsushika Hokusai, Great Wave off Kanagawa. Image from Wikimedia. Original in the Metropolitan Museum of Art, New York, USA
This week marks the 10-year anniversary of the Great Sumatra earthquake which triggered the devastating Indian Ocean Tsunami that killed a quarter million people. A rare and devastating event in itself, it was followed in March 2011 by an even larger earthquake and ditto tsunami in Japan, now known as the Tohoku event.
Two-thirds of the world population live at or below sea level. Almost all tsunamis are generated by oceanic earthquakes and are therefore a serious risk in many parts of the world.
People know that tsunamis are serious natural hazards (see my earlier post here on what makes a natural hazard). What makes them so dangerous is the relentless run-up of a massive wall of water that takes everything in its path. But how does that wall of water become so relentless and destructive?
Let’s look at what kind of waves there are:

Different types of waves, the forces that cause them (‘disturbing force’) and the forces that restore them. In this diagram, wave height is shown along the vertical axis in centimeters and wave period along the horizontal axis. Wave period is defined as the time interval between the passing of two successive wave crests (figure compiled from P. Pinet “Invitation to Oceanography” and from J.A. Knauss “Introduction to physical oceanography”)
On the left hand side of the diagram are wind-generated waves. To the right are Tsunamis and Tides (in between are “Seiches”, which I won’t discuss: here is a good link). Both wind-generated waves and Tsunamis & Tides can have wave heights of more than ten meters (1,000 cm). But wind-generated waves have fairly short wave periods, less than 100 seconds, whereas Tsunamis have wave periods anywhere from a few minutes to two hours. That means that the distance between two successive wave crests (the wavelength) of tsunamis is very long, much longer than for wind-driven waves. Tides, which are largely controlled by the gravitational effects of the Moon, have a wave period of twice 12.5 hours, because it takes the moon 25 hours to orbit around the earth.
Now let’s look at waves from a different perspective.
When a wave (energy) passes through a water body, the individual water particles make circular motions as shown in the image below, and this is what causes the wave, i.e. the energy, to travel. The image below shows how that looks in a so-called Deep-water Wave.
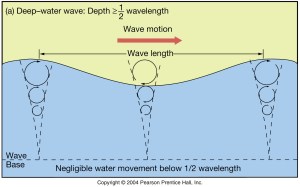
A deep-water wave. Water particles move in circular fashion. The force that drives the wave is usually the wind. The wavelength is the distance between two successive wave crests. For a deep-water wave, the water depth is greater than half the wavelength.
Below the water surface, the circular motion of the water particles decreases due to friction (they rub against each other). At a depth of half of the wave’s wavelength, the water particles no longer move. We call this depth ‘wave base‘. So the depth of the wave base varies with the height of the waves. Storm waves are higher than calm weather waves, and their corresponding wave base will be deeper than for calm weather conditions.
Wind-driven waves in the open ocean can have wavelengths up to a few hundred meters. Therefore their wave base is always in the water column (it doesn’t hit bottom) because the open ocean is on average 4 km deep. From the wave’s perspective the water is always deep. That’s why these waves are called “Deep Water Waves”. Deep Water waves travel with a velocity that is proportional to their wavelength, and because their wavelength is at most a few hundred meters, they don’t travel very fast. They move unobstructed across major water bodies until they arrive in water depths that are shallower than half their wavelength. Then their character changes to that of a Shallow-water Wave.
What is a Shallow-water Wave?
A shallow water wave is one of which the wavelength is greater than 20 times the water depth. The average depth of the oceans is 4 km, so their wavelength can be 80 km or more! The speed of a shallow-water wave is proportional to the water depth and independent of its wavelength. Hence, in great water depths, they travel very fast. Tsunamis and tides are shallow-water waves. A tsunami typically has a speed of about 800 km/hr in the open ocean. But their wave height in the open ocean may not be more than 1 m (see for example this link).
When a wind-driven deep-water wave approaches the shore, it becomes a shallow-water wave at some point. It starts to slow down due to friction against the bottom. But it doesn’t lose energy, at least not right away. What happens when a wave slows down but retains its energy? The wave height increases (this makes the surfers happy). At some point, the wave becomes higher than the water is deep (remember, we’re running up to shore). At that moment the wave becomes unstable and breaks (this makes the swimmers happy), and that’s when it loses energy quickly. The beach is formed in equilibrium with the average breaking wave height in a specific area (when the occasional exceptional storm hits the coast, the beach is not in equilibrium and the result is erosion).
The shallow-water waves that are Tsunamis travel at velocities of hundreds of kilometers per hour. They have such speed that they won’t be slowed down by the regular beach, they are not in equilibrium with the existing coast. As they run up the shore and before they break, their height increases massively and they destroy everything in their path until their energy is finally lost.
People are used to tides and tides can be predicted with great precision. For example, here in my back yard, in the Bay of Fundy, where the tides are higher than anywhere else in the world, high tide at Saint John occurs exactly 1 hour before high tide at Burntcoat Head, which is 180 km away across the water (see figure below). In other words: the-wave-that-is-the-tide travels at a speed of 180 kilometers per hour (yes, this creates potential for tidal power generation, about which I wrote an earlier post here). It runs up the coastal plain and submerges everything but because it does so twice every 25 hours, the shape of the coastline is in equilibrium with this phenomenon: it consists of vast expanses of tidal flats.

Bay of Fundy, Canada. The distance from Saint John to Burntcoat Head is 180 km over the water. High tide in Saint John occurs 1 hour before high tide at Burntcoat Head.
So a tsunami behaves exactly like the incoming high tide, with an even higher velocity. But because tsunamis happens to rarely, there are no tidal flats to indicate where you shouldn’t put your dwelling. In essence, people in tsunami-risk zones live in an overgrown and built-up ‘tsunami flat’.
People will continue to live near the sea for many reasons. There is now a tsunami warning system for the Indian Ocean, but lives will still be lost the next time a Great Wave materializes.
Four Billion Years and Counting: Canada is as old as the Earth and this book tells all
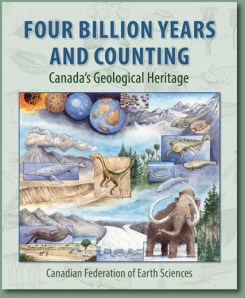
Just published! 400-pages on Canada’s geologic heritage in both official languages for only $39.95! Order your English language copy here and your French copy here.
The book’s website has tons of freely downloadable illustrations and other materials for educators
—–
One day last summer, a 40-ish well-educated woman visited our house. She makes a living in gastronomy, is a good visual artist and an avid ocean sailor. She asked me about my professional background and I told her that I am an earth scientist. She looked puzzled and said: “and what do you do with that, other than teach?”
Ai…….
I was dumbstruck for only a second, then noticed her nice shiny and stylish watch and said “well, let’s begin with your watch, where do you think its component materials came from?” Then it was her turn to look puzzled. And so evolved a conversation about steel, nickel, Sudbury, and on about the diesel that fueled the bus that she had taken that morning and about earthquakes that may cause tsunamis in her beloved Pacific Ocean.
This little incident is only one reason why we need earth science outreach products for the general public and why we as a society must cherish and promote recognition of and access to our shared geoheritage (here is an earlier post that I devoted to geoheritage in Canada).
“Four Billion Years and Counting” (4BY) is one of those products. What is unique about this book is that it’s only one of two products that covers all of Canada, the other one being a book called “Canada Rocks”, which came out in 2007 as the tangible result of the CBC television series with the same name. But unlike “Canada Rocks”, 4BY came out in both French and English at the same time, a fantastic accomplishment.
4BY is the result of eight years of work by more than 100 geoscientist authors from all over the country (full disclosure: I had a small role in the production of the book, but none in putting its content together). So yes, a book written by a committee! About 25% of the book’s authors are women. Given that Canadian Universities employ just over 20% women in academic positions in earth science departments, this is encouraging.
4BY is also, in a way, a sequel to “The last Billion Years”, a book about the geoheritage of Canada’s Maritime provinces, which came out in 2001, is now in its 10th print run and continues to sell steadily. That success was the reason for its editors to start researching a similar product that would cover the geoheritage of our entire enormous and geologically complex and fascinating country. 4BY is the result.
But starting from the history of the success of “The Last Billion Years” also carried a risk: that book came out 4 years before Google Earth was launched. Everyone who has a remote interest in the earth has Google Earth on their digital device of choice. Together with every earth science prof in the world, I started using it in my classes right away and life became different from that magical moment in 2005. Many earth science organizations now include linkages to Google Earth. For example, the Ontario Geological Survey allows you to download their geologic maps over your own Google Earth software. Just go here and click on ‘download bedrock geology’ and the bedrock geological map of Ontario will open over your own Google Earth.
I know that this is a book and not a software system. But I don’t really see how a book like this can go without even referring to Google Earth once. Or to Aeromagnetic surveying, a crucial technology for understanding tectonic history and – ultimately – for finding mineral resources of which we know that Canada has lots. The book does have introductions about multibeam bathymetric mapping and about seismic surveying, however.
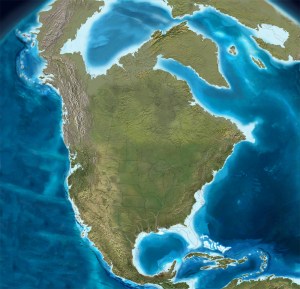
North America in the middle Miocene, ca. 15 million years ago. Image as in the book, from the image database by Ron Blakey
While 4BY is not intended as a textbook, it is organized as one: part I (15% of the book) covers the Foundations of geologic science, part II (50%) the Evolution of Canada, and part III (35%) is called Wealth and Health and pertains to the practical applications of geology to our economic and physical well-being. Wealth and Health has chapters on Canada’s Mineral Resources, Energy resources (coal, hydrocarbons, uranium and a tiny section on renewables), a wonderful section on building stones with a special inset about the building stones of Québec City, an extensive chapter on water resources, one that covers all the aspects of coasts (erosion, management, etc.), one on earthquakes (and landslides and tsunamis), one on impacts from outer space (I happen to have a post about those here), and one on environmental challenges. I think I’d recommend every neophyte geoscientist reader to start with this third part of the book, because – like our visitor last summer – that’s where the uninitiated reader gets the idea that this stuff just might be relevant for …….. well… their wealth and health!
The book is aimed at the general public so its language had to be carefully crafted to be both understandable and inviting. Most chapter and section headings certainly accomplish that. Wouldn’t you be curious to read on after headings entitled “Spheres of Influence”, “Continental bulldozer”, “Hell on Earth” or “Rolling up the Rim”? However, the text itself does require a reasonably initiated person, because it is in places rich in jargon. Fortunately there is an exhaustive index.
The photographs are a lust for the eyes: hundreds of pictures were submitted by armies of happy snap-shooting earth scientists, so the editors (one of whom is an accomplished photographer himself) were able to select the very best ones from a true horn of plenty. It is an appetite-wetting virtual geologic road trip through our country. There are also portraits of famous Canadian geoscientists, going back to 18th century Abraham Gesner, but I did miss a portrait of the great (20th century) J. Tuzo Wilson. In addition to photographs, there are dozens of explanatory diagrams and quite a few artwork reproductions. Especially the latter are worth mentioning: some of them are from museums, so we get to look at images of spectacular museum dioramas of and of the iconic Beringia paintings of George “Rinaldo” Teichmann. The paleogeographic maps are all by Ron Blakey, certainly the best.
The book will be accompanied by a website, which isn’t up yet. I understand that the website will be targeted especially to teachers and I can see that this book will be extremely valuable, together with the website, for high school science / earth science / evolutionary biology classes. I look forward to the site, because together with the site, the body of work may become a little easier to navigate. I missed that figures aren’t numbered and when the text refers to a certain section, it will not give the page number of that section. Many pages contain a string of places names, assuming that the reader knows exactly where those are. Most average citizens don’t, so a bit more geographic indexing would be helpful. As for me, I studied the book while sitting behind my computer and using the superb Atlas of Canada for finding my way around.
Overall, this is a exceptional contribution to the documentation of our amazing Canadian geoheritage legacy and I encourage everyone to buy this book pronto, for yourself and for whoever is on your gift-giving list.
===
update September 14, 2015: the book was also reviewed by Arthur Tingley for the Geological Society of London
Posted in General geoscience, Geoheritage
Tagged Canada, earth science, energy, environment, evolution, extinction, geology, Ice Age, natural disaster, natural hazard
Leave a comment
Canadian Earth Science for @PMHarper 9 – measuring the thickness of polar sea ice through time
The preamble to this reviews series, categorized as “Canadian Earth Science for @PMHarper”, is here.
—
de Vernal, A., R. Gersonde, H. Goosse, M.-S. Seidenkrantz, and E.W. Wolff, 2013, Sea ice in the paleoclimate system: the challenge of reconstructing sea ice from proxies – an introduction. Quaternary Science Reviews. v. 79, p. 1-8.
Climate is warming, ice caps are melting, thinning and retreating. The Arctic ocean shows dramatic declines in summer sea ice every year, leading to increased development pressure (shipping, mining, tourism). After the all-time low of 2007, Arctic summer ice in 2013 was at its 4th smallest extent (well explained here). In Antarctica, however, sea ice has been on the increase in the last few years. This phenomenon is not yet totally understood, but may be related to the faster movement of Antarctic ice caps caused by them melting away from the bedrock below (but this is difficult to determine and not the subject of this review, see for a recent overview of this issue this page).
The ice conditions in the Arctic and Antarctic are related to the land configurations and both poles are total opposites: the North Pole is an ocean surrounded by land whereas the South Pole is a continent surrounded by ocean. Couldn’t be more different.

Polar maps of the northern and southern hemisphere. The arrows illustrate the main drift patterns, which are also responsible for sea ice dispersal and melt towards low latitudes. In the Arctic map, BG and TPD stand for Beaufort Gyre and Trans Polar Drift. The pink line corresponds to the 1979-2000 average maximum sea ice cover extent in March (northern hemisphere) and September (southern hemisphere), the months when sea ice is at its maximum in either hemisphere (illustration and caption from the article under review).
If you want to predict the future, you must understand the past. Geoscientists understand that as no-one else: our entire science is based on the principle that “the present is the key to the past and vice-versa”.
Why is it important to understand past sea ice conditions? Because sea ice “acts as an amplifier: it influences the energy budget at the surface of the Earth because it reflects a significant part of the incoming solar radiation (it is white) and because it limits the heat exchange between the ocean and the atmosphere” (quote from the article). Therefore: if long term (Ant)Arctic sea ice cover changes drastically, that will have an effect on long-term weather patterns and thus on climate.
Also: if a lot of sea water freezes and the sea ice cover expands, then the ocean becomes more salty, because salt doesn’t freeze (sea ice is not salty) and salt water is heavier than fresh water, so it starts to sink, and that affects ocean circulation and thus…. climate.
And: saltier water supports a different population of (micro)organisms than less salty water and most of these organisms breathe by absorbing CO2, so when you change the population, the amount of CO2 absorbed in the ocean changes and this ….. affects climate.
And so on.
So – it would be really good to know how sea-ice changed over time so we can better understand our past climate changes and – eventually – better model what the future holds for us.

This graph illustrates how global temperature and polar ice volume (both on the vertical scale) varied over the last 450,000 years (horizontal scale). The reconstruction is based on the analysis of two ice cores (Vostok and EPICA) from Antarctica (image source here). The present day average temperature is set at 0 (zero) because the graph shows the deviation from the present. The symbol Δ means ‘change’ or ‘deviation’ so the vertical axis of the top 2 curves (blue and green) indicates the deviation from the average present-day temperature in Antarctica during the last 450,000 years. The lowermost curve (pink) indicates the estimated change in global ice volume over this time period.
This paper by Anne de Vernal and others is the introductory article of a 230-page special issue of the journal Quaternary Science Reviews of which they were the guest editors. The title of this article is also the title of the entire issue; this paper is the State-of-the-Art summary of this important new research field. The entire list of articles of this volume is here.
Problem: we only have direct observations of sea ice conditions from satellites since about 35 years and through a variety of other direct measurements since maybe the end of WWII. “Direct observations” are measurements of actual ice conditions. Which are difficult enough even with the sophisticated equipment of today: see this video for an impression of those challenges. If we want to know sea ice conditions from before WWII, we must find trustworthy and measurable indicators for sea-ice conditions. Such indicators are called proxies. Another word for proxy is substitute. To help you wrap your mind around this: imagine you couldn’t measure summer temperature, but you did want to know what kind of summer it had been. Imagine local beaches tracked the number of visitors each summer. If you collected the number of visitors for each beach, you would get an indication of which days were really nice, because there would be more visitors on hot days (you would have to account for holidays and weekends). Beach visitors would be a proxy for summer weather.
The most useful proxies for oceanic conditions are generally microscopic organisms. When they die, they fall to the ocean floor and become part of the sediment (some of them disintegrate or get eaten, but there are so many of them that a lot of them end up on the ocean floor). When we sample that sediment by taking cores off a research vessel, we can measure (later, in the lab) all kinds of properties of those organisms and these properties give us clues about the conditions (light, temperature, salinity) under which the organisms lived.

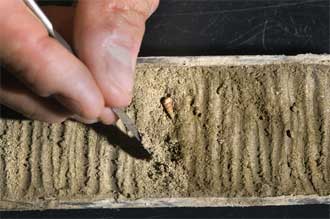
Left: A piston corer is launched over the side of a research vessel (image source here). Right: a core that’s cut open lengthwise to show finely layered sediment (image source)
But organisms on land also react to changing climate conditions. Trees grow faster or slower depending on the seasons and tree rings tell us. Dendrochronology (from Greek: ‘dendro’=tree, ‘chronos’= time and ‘logos’ = knowledge) is the scientific term for tree ring studies. Tree rings are excellent proxies. Trees grow one ring per year. The thickness of the rings tells you something about temperature and humidity conditions. Here is a link to the International Tree Ring Data Bank. It’s very important to be able to try to correlate ocean- and land-based proxy data.
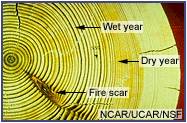
When tree rings are widely spaced, climate was moist and trees grew faster than during dry years, when the rings are more closely spaced.
A little more than three years ago, a number of climate scientists agreed that sea-ice is an important but insufficiently understood climate driver. They got together for a workshop at UQAM in Montreal, home base of Anne de Vernal and decided to form a working group to share their sea-ice methods and results to see if they could improve our understanding of this phenomenon.
This volume of articles is an outcome of that exercise. What an accomplishment! You get together in the summer of 2011 and you get 18 articles published in one volume two years later. Wow.
Nine sea-ice condition proxies are identified in this paper and each is evaluated for its advantages and disadvantages. Some proxies are brand-new discoveries, some have been known for a few decades, but in general you can safely state that this is a 21st century field of research.
The authors emphasize that individual proxies cannot be used in isolation, but should be considered complementary to each other. In other words, if you want to draw conclusions with respect to past sea-ice conditions, you must use a combination of proxy data. This is because conditions vary regionally and between ocean and land; also the sea-ice thickness varies regionally and seasonally and this has an effect on organisms. Also: some organisms only live in either polar region. In addition, we don’t really know enough about how organisms react to changing conditions, so scientists must experiment with different proxies and compare the results. If the results line up, you’ve got working methods, you’ve got a tool.
Considering the current State-of-the-Art, the authors conclude that there is every reason to be confident that sea ice conditions during the last half million years can be confidentially reconstructed in the coming years using these different proxy methods. They admit that there are still many challenges and they aim to address those in the coming years. Altogether a very admirable result.
Predicting future climate is hideously difficult because there are so many factors that play into climate. Sea-ice is just one of those factors and it will take a few more years before that parameter can be built into future climate models. It’s science, after all: nobody promised it would be quick and easy.
It’s somewhat humbling to realize that this research was financially supported by PAGES (Past Global Changes, a research program funded by the US and Swiss National Science organizations and by NOAA) and by a grant from the European Union’s 7th framework programme.

Cartoon from the Australian Department of the Environment / Antarctic Division. Image source here
#Katrina10. #Louisiana is still disappearing
I wrote this blog post in November of 2014. I am reblogging it today, on the 10th anniversary of Hurricane Katrina.

Land loss map of South Louisiana. Image source here. Click on image to enlarge.
Is it the weather? No fewer than three long, detailed and well-researched articles in important media discussed the continuing story of increasing land loss in South Louisiana. The Globe and Mail’s Omar el Akkad wrote an insightful piece about disappearing Louisiana in the October 18 paper. The October 5 New York Times Magazine’s main article was a heart-sinking rendering of the fight of a few individuals against the sheer unwillingness of anyone to do anything to save the State of Louisiana. The New Republic Magazine ran an article on September 30. The latter two articles particularly focused on corruption.
All three articles were excellent, so why should I want to add anything?
I am a sedimentary geologist. I worked for the Louisiana Geological Survey from 1981 to 1986. Most of that time I worked on marshes – disappearing marshes. I was one of a team of about 6 young ambitious geologists, brought together under the Louisiana Geological Survey’s Coastal Geology Program, an initiative to inventory and understand the causes of the State’s land loss. We were not the only official program working on these issues in the State at the time. We cooperated with the Louisiana Universities Marine Consortium (LUMCON), with scientists at Louisiana State University’s Coastal Studies Institute and with its Center for Wetland Resources. And that’s not counting the – Federal – US Geological Survey and the US Army Corps of Engineers. We worked on barrier islands, hurricane impacts, sediment budgets, marsh dynamics, nearshore currents, river dynamics, you name it.
Did we come up with new information? I think we did, if only for the sheer volume of new data that we gathered, analyzed and published, both as technical reports and as articles in internationally peer-reviewed scientific literature. There were a couple of new ideas and new insights, but I think it’s realistic to state that we mostly added lots of data and lots of detail to a story that was basically known and accepted by the mid 1960’s: the Mississippi Delta consists of ephemeral land because the river is – as Omar El Akkad wrote – a ‘side-winder’ and has been prevented from behaving as such for several centuries because of levee-building by its inhabitants (European colonizers). Thus, vast amounts of river sediment end up in 4,000 m water depth off the present-day river mouth (which is completely artificial) rather than being available for nourishing the delta plain’s marshes and bays (important nursery grounds for the fisheries) and its skimpy but crucially important barrier islands and beaches (I wrote earlier about the fragility of Gulf of Mexico barrier islands here).

The Mississippi Delta is a side-winder. Depicted are the 5 main Holocene (less than 10,000 years old) delta complexes each with a number of individual delta lobes. The oldest delta complex, the Maringouin, has subsided and is below sea level. If the Mississippi would not be confined by artificial levees, it would have switched back to the Maringouin area by now: the present day Atchafalaya river and delta (blue arrow) occupies that position but river locks further north only permit it to carry about 1/3 of the total river load. The Atchafalaya route is 250 km shorter and significantly steeper to the sea than its current route and thus the preferred route from the river’s perspective. Image by Louisiana Geological Survey.
We knew this 30 years ago. We were never prevented from communicating these observations to the general public by the way. In fact, we were encouraged to do so and I clearly remember a TV crew in our core facility. Our director (who later became a USGS director) didn’t tell us what to say to the press – ever. The most vocal member of our team even got a New York Times Obituary when he passed away 8 years ago.
We did not think climate change back then. But you don’t even need rising sea level to declare an emergency: the Mississippi Delta is sinking because its sediment is waterlogged. Natural compaction squeezes the water out and makes the land sink. If you prevent the delta and the coastline from being nourished by its own sediment, the land loss due to compaction will be exponentially worse. If you allow the oil and gas industry to dig thousands of kilometers of canals, which disturb the delta’s hydrology, enabling salt water to penetrate landward, thus killing marshes and generating open water bodies, then you really have a problem.

Author negotiating a disappearing marsh in the Mississippi Delta in 1984. This particular area was becoming infiltrated with salt water at the time, and this killed the fresh-water vegetation. It is now open water.
Hurricane Katrina slammed into Louisiana 9 years ago this summer (August 28). You’d think that that catastrophe would have led to some action. It didn’t. Some engineering companies got a few contracts. But soon after Katrina, people in power got really tired of scientists telling them why the land was disappearing. Louisiana State University even fired a tenured professor who told the truth, but had to pay him a hefty sum in damages a few years later. In the Globe and Mail article, Louisiana Governor Bobby Jindhal is quoted as saying that the oil and gas industry provides 60,000 jobs and therefore shouldn’t be the only actor pay the price for this catastrophe. He suggests maybe the fishers should pay a price as well. Really? Since when have fishers wealthy shareholders and corporate exit bonuses? That was just political distraction tactics by th governor. Because the truth is, you can’t allow the river to switch to its preferred location (the Atchafalaya course) because from Baton Rouge southward, the river would fill with sediment, New Orleans as a harbour would disappear and since it’s the lagest bulk port of the US, that’s unaffordable.
Is Louisiana an exception in the world? On the margin, I don’t really think it is. It’s true that Louisiana is an eccentric State. It is the only State in the US with a legal system based on the Code Napoleon rather than on the Anglo-Saxon Code and so all its legal experts are educated in Louisiana and this leads to professional inbreeding and corruption. That’s not a secret. So it’s a bit of a banana republic. It also has way too many very poor people, which is entirely unnecessary given its petroleum wealth, but there you go – that’s Louisiana.
After Hurricane Katrina, I put together a talk on the catastrophe. I gave that talk several times as a fundraiser. The money was for a public school in Baton Rouge that saw its population doubled in the first week of the school year (the hurricane hit on August 28) and had no funding for the additional required supplies. To this day, I am told what an eye-opener that talk was and that the story was in essence so simple that it was hard to believe nothing was ever done to mitigate the situation. Nice. Thank you. That was 9 years ago.
Is Louisiana exceptional in this respect? As a global society, we haven’t been willing or able to reduce green house gas emissions one bit, never mind overwhelming evidence that we must, if only for being at a serious risk of losing exponentially more land than is being lost in Louisiana. I can run off a list as long as my arm with examples of environmental hazards and disasters waiting to happen and elected decision-makers (aka politicians) sitting on their hands. Maybe it’s the weakness of democratic society or the general tendency of the public to stick its head in the sand and elect officials who are good at that too. Louisiana or the world, we will all still be discussing mitigation efforts when the water is at our lips.
A
“Politicians discussing Global Warming”. Installation by Spanish artist Isaac Cordal (Berlin, Germany)
Posted in climate change, General geoscience, Natural hazards
Tagged barrier islands, climate, Climate Change, coastal zone management, earth science, environment, geology, geoscience, Hurricane Katrina, Louisiana, marsh, Mississippi Delta, natural disaster, natural hazard, Politics, Science, Sea Level, sea level rise, sedimentology, wetland
2 Comments
Canadian Earth Science for @PMHarper 8 – Earth in the firing range
The preamble to this review series is here. All reviews in this series are categorized as “Canadian Earth Science for @PMHarper” (see right hand column).
—
Spray, J.G. and L.M. Thompson, 2008, Constraints on central uplift structure from the Manicouagan impact crater. Meteoritics and Planetary Science, v. 43, no. 12, p. 2049-2057.
The people of Chelyabinsk didn’t see it coming. And we only know what it looked like because many Russians are in the habit of running dashboard cameras (dashcams): a flash, a loud detonation, shattered windows, 1500 panicky injured people (mostly because of flying glass). No casualties, thank goodness. The Chelyabinsk meteor was about 20 m in diameter and could have done a lot more damage had it come down a few kilometers to the Northeast in the middle of the city of Chelyabinsk. Mustn’t think of it.
Less than two weeks after the Chelyabinsk meteor came down, Canada launched a ‘suitcase-sized’ satellite to track asteroids and space debris. That timing was completely coincidental of course. The main reason that launch got lots of media attention was the recent near-disaster in Chelyabinsk (a good write-up about the difference between meteors and asteroids is here).

The last bit of the Chelyabinsk meteor came down on February 15, 2013 in the middle of solidly frozen Chebarkul Lake (image source).
The dinosaurs didn’t see it coming either, at least we presume they didn’t. The asteroid that hit Earth 65.5 million years ago on the Yucatan Peninsula was ca. 10 km in diameter. Most likely this hit was the main cause of the extinction of most – large – reptiles (such as dinosaurs), making room – eventually – for mammals, including ourselves. The idea (hypothesis) that a large asteroid could have hit earth and caused this particular mass extinction was introduced only in 1980, when it was considered utterly bizarre even by most experts. Like many utterly bizarre ideas, it proved to be pretty good, especially when the Chicxulub crater was actually found – and proved to be of the right age – 12 years later after the original hypothesis was formulated.

The Chixculub (meaning ‘tail of the devil’) asteroid hit in what is now the Yucatan Peninsula of Mexico, but Yucatan didn’t exist 65 million years ago: this was all ocean (image source is here).
The Manicouagan crater in our own Québec is a lot older than Chixculub: 214 million years. Known also as “the eye of Québec”, it became instantly recognizable as an impact crater after flooding of the Manicouagan river by Hydro Québec in the 1960’s. Now anyone can see it on Google Earth and many astronauts, including Canada’s own Chris Hadfield, have photographed it.
Manicouagan is the fourth largest impact structure on earth. No tectonic forces have influenced or altered it since its inception. The asteroid hit nearly 1 billion year old Canadian shield rocks. After this event, not much else happened geologically, other than the normal amount of erosion, but it never was an area with high mountains so that wasn’t a whole lot. Then the ice caps of the Quaternary glaciations swept across it, nicely cleaning off debris and making it even more easily visible, so it’s a a rather pure and unchanged impact crater.
The Manicouagan reservoir, highlighting the Manicouagan impact structure.
184 confirmed impact structures pock mark our planet according to the Earth Impact Database, maintained at the University of New Brunswick’s Department of Earth Sciences, also the home base of John Spray, first author of the article under review here. The world’s oldest known impact crater is the 2.4 billion years old Suavjärvi in Russia. Very close to that one in age is the Vredefort crater in South Africa (2.023 billion years old), which is also the world’s largest at 160 km diameter and is – after all this time – easily recognizable on Google Earth and from space. There were likely lots and lots more asteroid hits during earth’s 4 billion year history, but because the earth’s crust is constantly recycled by plate tectonics, we will never know about them (there is no plate tectonics on the Moon, therefore we can see every crater it ever had).
Why study the geology of asteroid impact structures? These structures are studied because, other than for pure scientific curiosity, they host important minerals in large concentrations in a manner that is unique for impact structures. The city of Sudbury marks Canada’s most productive impact structure: it hosts one of the world’s largest nickel deposits . The Sudbury bolide had a diameter of 10 to 15 km and came down 1.8 billion years ago. Everyone knows that Sudbury is the metal capital of Canada, celebrated by their ‘big nickel’. Nickel is an essential mineral for hardening stainless steel. Recent research by Canadian geoscientists, however, favours a comet over an asteroid for the Sudbury impact (articles here and here).
So what happens when an asteroid hits earth? It depends on the size of the asteroid, so here we’ll limit ourselves to the ones that leave a crater of at least 3 km in diameter. Here is an excellent animation

Animation of an asteroid impact (GIF source here)
The animation shows that such a big impact results in:
- a field of ejecta (thrown about bits and chunks) outside the crater itself
- a crater with faults around the perimeter (where loosened bedrock slid back down),
- a melt sheet overlying the original bedrock in the crater; the original bedrock is usually also fractured and altered by the high temperatures (the nickel in the Sudbury impact structure became concentrated at the base of the impact melt sheet).
- a distinct central uplift in the crater
The Manicouagan structure has all the features of large impact craters.
Manicouagan impact crater seen from the East. The reservoir is in the foreground, the central crater uplift (Mount Babel) is in the background. Panoramio image from Google Earth
The central uplift of the crater is what we now call Mount Babel. Mount Babel’s rocks consist of 1 billion year old basement rocks (gneisses) that were not affected by the asteroid. If you go to Google Earth, search for Mount Babel and tilt the image, you can easily see the central crater uplift that gives this mountain its name.
The article by Spray and Thomson focuses on new details about Manicouagan’s subsurface, revealed through the study of cores obtained by a mineral exploration company. What was learned?
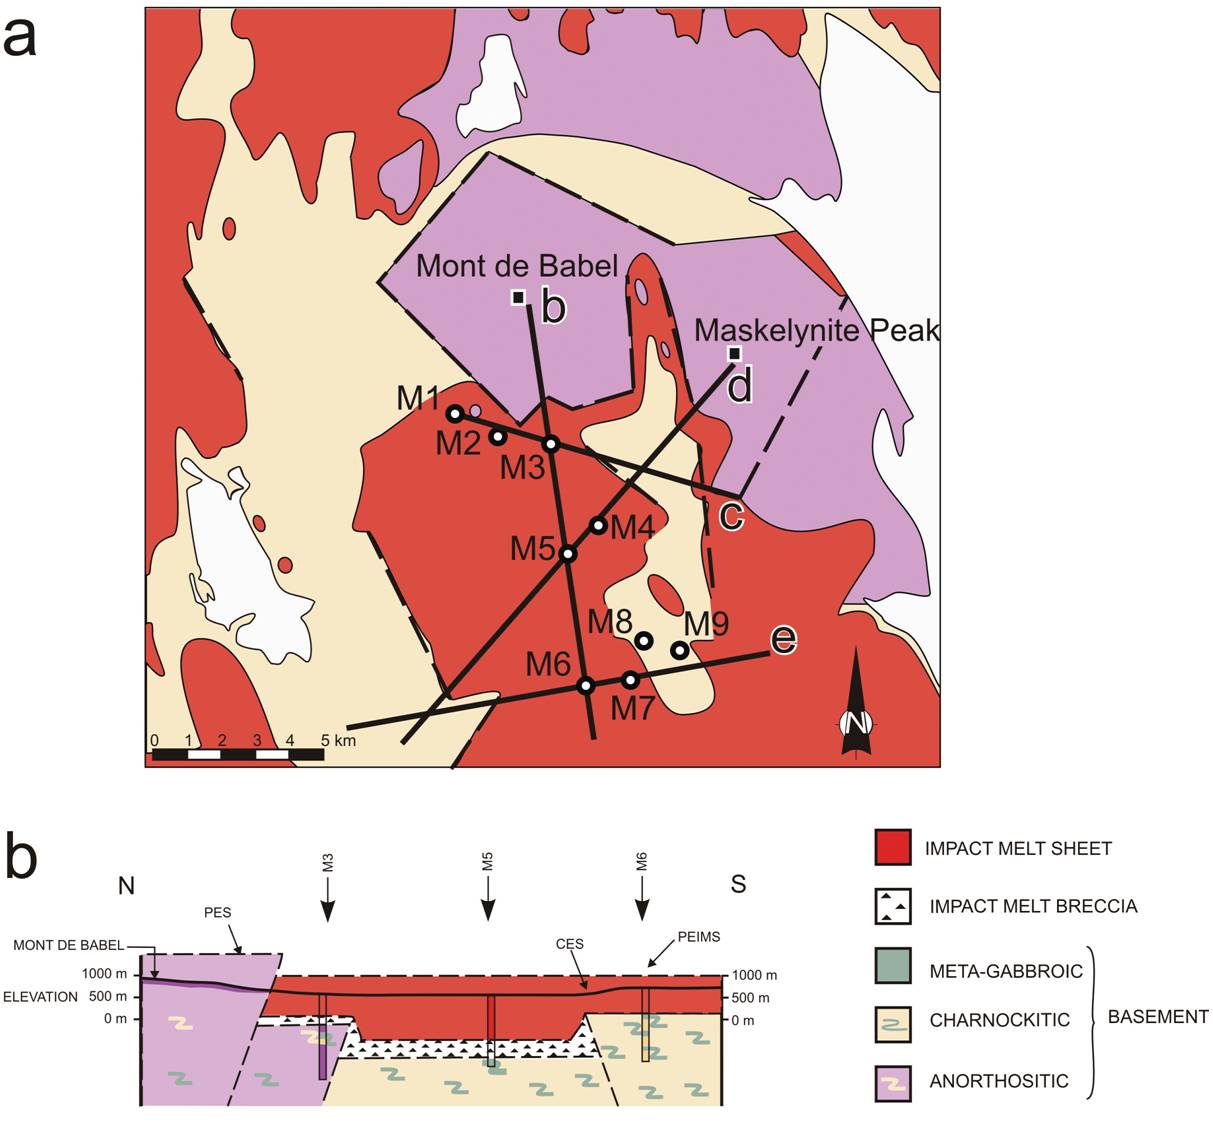
Above: Geologic map of the central part of the Manicouagan impact structure. Below: geologic cross section b (location on map above). Figure from the article by Spray and Thomson
The study revealed that the Manicouagan melt sheet has a variable morphology and is in places up to 1 km thick! This was a lot more than was originally estimated. Because the drill cores extended beneath the melt sheet, the researchers could observe that the basement rocks underlying it do show evidence of the impact – they have ‘shocked’ characteristics, meaning that the impact changed the nature of some of the minerals that make up these rocks.
The geologic cross sections show that there are faults alongside the crater (as expected). But these faults do not breach the melt sheet, from which the authors conclude that they were active before the melt sheet solidified. It’s possible that these faults run along lines of pre-existing (more than 1 billion year old) faults, but this cannot be proven. The faults are most likely a combination of re-activated pre-existing faults and faults newly created by the impact and occurred within 1000 years after the impact.
The longest core (M5) shows that the melt sheet isn’t uniform: it consists of three distinct layers of igneous rock (solidified melt) of subtly varying composition. Thus: as the melt sheet slowly cooled and hardened, different minerals settled at different depths according to their density: the melt sheet was fractionated, after it had been very well mixed and homogenized prior to it beginning to cool and solidify. Imagine that: an object of 5-10 km diameter hits very hard very old Canadian shield rock and instantly completely melts that rock as far down as 1 kilometer below the earth’s surface. Manicouagan is now only the second impact crater known to exhibit such fractionation (the other one is Morokweng in South Africa).
So yes, while the impact and the melting was instantaneous, faulting lasted much longer, although still pretty much instantaneous from a geologic time perspective.
The authors used all this information to try to figure out how exactly the central uplift structure originated. They present four different dynamic models but their information doesn’t allow them to decide which dynamics led to the structure’s features, leaving room for more research.

The Manicouagan melt sheet up close. Panoramio image from Google Earth
—-
Earth is in the firing range and it’s important that we study the projectiles aimed at us in order to possibly mitigate a global catastrophe. But it’s also important to study existing impact structures in order to improve our understanding of critically important mineral occurrences associated with these structures.
And finally: whereas the 10 km diameter Chixculub asteroid was mostly likely the cause of the mass extinction that marks the end of the Cretaceous era (the era of reptiles, i.e. the dinosaurs), the 5-10 km large Manicouagan asteroid didn’t cause a mass extinction. Why? That is a topic for a different blog post.
References
Popova, O.P. et al., 2013, Chelyabinsk Airburst, Damage Assessment, Meteorite Recovery, and Characterization. Science, V. 342 no. 6162, pp. 1069-1073. DOI: 10.1126/science.1242642
#Women in (Earth)Science: Dr. Lui-Heung Chan (@FindingAda)

It’s 30 years ago this Fall that I registered for ‘Chemical Oceanography’, a graduate level class at Louisiana State University as part of my PhD program in Marine Sciences.
The class was taught by Dr. Lui-Heung Chan, a quiet woman whom I had never spoken to before. I had just seen her around the department, dashing in and out of her lab, always dressed in a white lab coat.
Our textbook was “Tracers in the Sea” by Wallace Broecker and Tsung-Hung Peng, published just 2 years before. It became a legendary text, although it was never published again (maybe there were more print runs, I don’t know). It was the craziest textbook you ever saw, because it was essentially a (hard-bound) typewritten document: 702 pages in courier font! It looked absolutely archaic even then. Little did we know that this was going to be one of the great oceanography classics. “Tracers in the Sea” was published by Columbia University’s Lamont Doherty Geological Observatory (where Dr. Broecker works to this day) and LDGO (or, as it states on the book: “Eldigio Press”) has made the entire book available on their website (downloadable pdf).

At the time, I had no idea that Dr. Chan had done crucially important work on Barium data from the Atlantic GEOSECS* (Geochemical Ocean Section Study) expedition. Her 1977 article on this subject has been cited more than 200 times according to Google (probably a conservative number). The results from the GEOSECS expeditions form the basis of “Tracers in the Sea”.
The class proved to be one of the most challenging I ever took. Dr. Chan meticulously and patiently guided us through every chapter of “Tracers in the Sea”. Thus I became familiar with the data behind the ‘global conveyor belt’ (the global thermohaline circulation), a term coined only a few years earlier by Dr. Broecker, who was one of the initiators of the GEOSECS expeditions (Read all about them here).
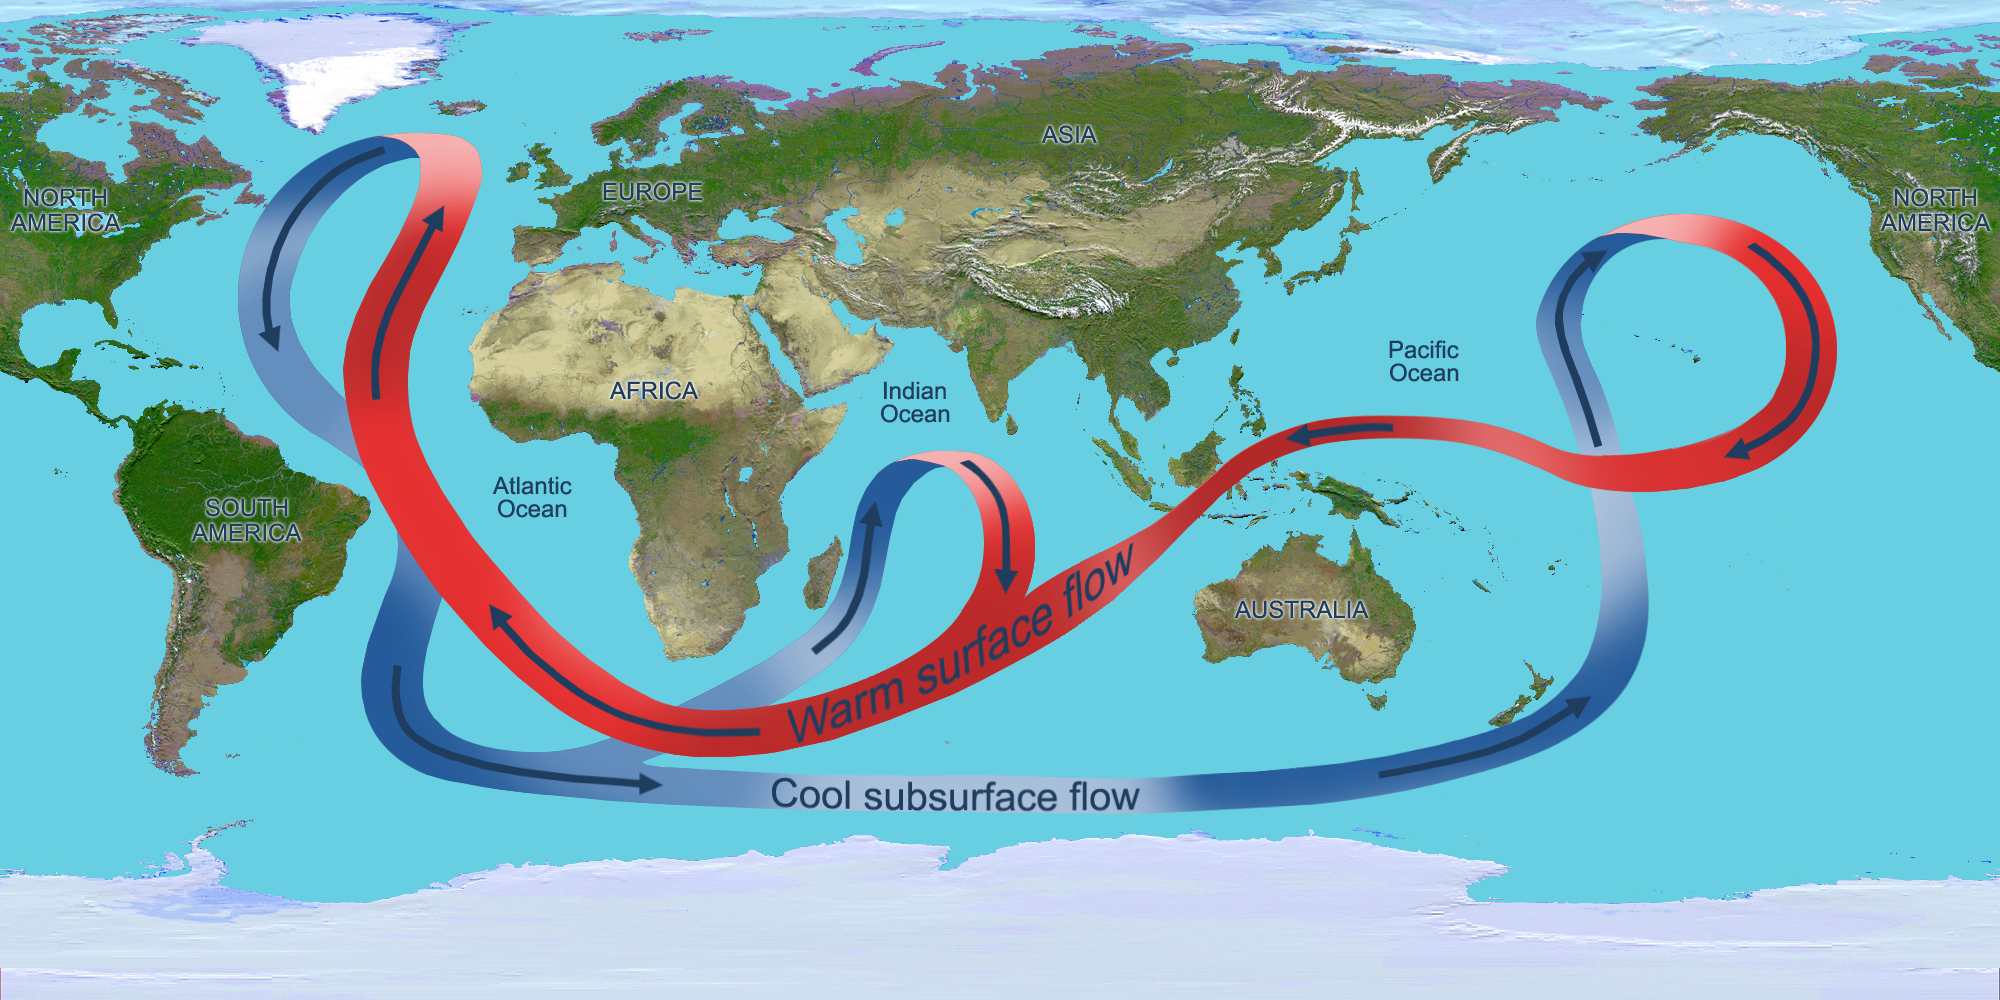 Left: Sampling stations of the GEOSECS expeditions. Right: “Global conveyor belt” , i.e. global thermohaline circulation
There were problems to solve with every chapter, assignments, a rather serious term paper and two tough exams. Throughout the class, Lui Chan remained friendly, soft-spoken, and….. tough. I think she was so brilliant that she could hardly imagine we had reason to struggle with the material.
In her quiet way, she impressed upon us what she thought good science was. Good science resulted in simple and elegant solutions and ideas. A scientist should wait with publishing until he/she had enough data to come up with a meaningful story. When discussing a particular isotope, she distributed an article that had recently been published in the journal Science. She mentioned that the researcher had not published anything in a few years before this important paper and she thought that was the way to do it.
“Chemical oceanography” was an eye-opener, probably the best class I ever took. I asked my advisor if Dr. Chan could serve on my committee and he agreed. After all, I had a bunch of radiocarbon dates. She asked me some really tough questions about those at my defense two years later, leading to a few sleepless nights on how to phrase my conclusions so that she would accept them (I managed, she did accept them).
—
Lui-Heung Chan was born in Hong Kong in 1939. She left for the United States in 1961, completing her PhD at Harvard in 1966. She married Lei-Him Chan, a Harvard PhD physicist. They both got faculty positions at Louisiana State University, he in the physics department and she in the department of geology and geophysics. They had two children.
She was the first woman to become a tenured geology professor at LSU (subsequently in the Charles Jones endowed chair in geology and geophysics). Her most important contributions were made in understanding Lithium in the earth’s crust and oceans. She was a role model for women in science. Sadly, she died after suffering a stroke in 2007. She was 68.
References
In Memoriam http://issuu.com/slebl23/docs/alumnimagazine2006_2007
Chan, L.H., D. Drummon, J.M. Edmond and B. Grant, 1977, On the Barium data from the Atlantic GEOSECS expedition. Deep Sea Research V. 24, p. 613-649.
Chan, L.H., J. Lassiter, E.H. Hauri, S.R. Hart, J. Blusztajn, 2009, Lithium isotope systematics of lavas from the Cook–Austral Islands: Constraints on the origin of HIMU mantle. Earth and Planetary Science Letters, v. 277, no. 3-4, p. 433-442.
—-
* The GEOSECS Program was conceived in 1967 and began at the start of the International Decade of Ocean Exploration in 1970. The objective of the program was “the study of the geochemical properties of the ocean with respect to large-scale circulations problems.” We know very little about the oceans today, 45 years after the start of GEOSECS, but we knew absolutely nothing back then and technology was nowhere. GEOSECS yielded massive new insights in ocean circulation and chemistry and provided the basis for understanding the link between oceans, atmosphere and climate.
Posted in General geoscience, Women in geoscience
Tagged climate, Climate Change, earth science, geology, geoscience, oceanography, Science, women
Leave a comment
And then there were two: Global #Geoparks in Canada
UPDATE: 19 NOVEMBER 2015. Great News!! Global Geoparks are now official UNESCO sites.
“A what? ”
“A Global Geopark”
“Okay, I give up”
Most of you have no idea what a Global Geopark is. That’s not surprising, because – according to my WordPress statistics – most of you are located in Canada and the United States and there are only two (2!) Global Geoparks in these two countries, both of them in Canada: Stonehammer Geopark in the Saint John (New Brunswick) area (enlisted in 2009) and – as of this week! – Tumbler Ridge Geopark in British Columbia. I wrote about Stonehammer in an earlier post as well and I have just added Tumbler Ridge to that post.

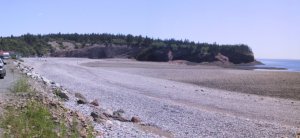
St Martin’s (New Brunswick), one of the sites of the Stonehammer Geopark. Left: drawing by Sam, a grade 2 student from an elementary school in Saint John. The students welcomed the delegates to the Global Geoparks Conference with songs and gave us artwork inspired by the different Stonehammer sites. Right: my own photo of St Martin’s
There are about 115 Global Geoparks in the world, most of them in Europe and the Far East (predominantly in China and Japan). There isn’t a single Global Geopark in Africa, Australia, New Zealand or the Pacific and there are only two in all of South America. If that seems lopsided, it probably is, but it does explain why most people in North America are clueless about them.
So what exactly is a Geopark?
Let’s first explain what it is not: a Geopark is not a Park in the traditional (North American) definition of the word, i.e. a well defined area set aside for whatever recreational or conservation purposes under the authority of a government body.
Then what on earth is it?
The following is from the Guidelines for Canadian Geoparks:
“A Geopark is an area with significant geologic heritage elements, which may include:
- Scientifically important or striking and unusual geologic phenomena
- Sites where historically important geologic features were first recognized and described
- Outstanding examples of geologic features and landforms
- Historic sites where cultural events were tied to an area’s geologic features, such as those in the history of geology, mining and geology in early exploration and settlement.
The overall goal of a Geopark is to integrate the preservation of significant examples of geological heritage within a strategy for regional sustainable socio-economic and cultural development, while safeguarding the environment”.
Right – you can’t just declare an area a geopark, there has to be a strategy for development and that strategy has to be environmentally-friendly and sustainable. So the challenge is to integrate geologic heritage with regional economic development and ‘greenness’.
Geologic heritage is just about everywhere around us, but most citizens are only minimally aware of that heritage and that is precisely the point of a Geopark: raise awareness of geoheritage with local citizens (K-12 and beyond) as well as visitors. Protect the environment, while providing incentives for local business, especially tourism-related business.
So a Geopark is not a fenced-off hands-off area. On the contrary: it’s a no-fence hands-on area where local business operators cooperate to promote geoheritage through a series of fun and educational activities for all ages. This cooperative effort is independently managed by a board, composed of citizens representative of that Geopark community.
You might argue: that’s an interesting idea, but why do we need this whole new category called Geoparks? Aren’t there enough regular opportunities to celebrate geoheritage?
Good point – there are lots of opportunities to celebrate geoheritage and we’re reasonably good at it in Canada (see my earlier post on the Canadian geoheritage surge here).
But what makes Geoparks special is that this has become a global movement. The thought behind the original idea (launched ca. 20 years ago by an earth scientist-staffer at UNESCO headquarters in Paris) was that the world has lots of valuable Geoheritage that doesn’t qualify as UNESCO World Heritage and that most of that Geoheritage tends to get ignored by the world’s various park organizations, which overwhelmingly focus on living nature and archaeology without paying too much attention to the deep-time-origin of much of that living nature.
How do we define Geoheritage? Geoheritage is the physical evidence of:
- the origin and history of our planet and the changes it went through (including astonishing and bizarre climatic changes)
- when and where life on earth began and came from (evolution as shown by the fossil record)
- the role of our planet in providing us with resources (you are likely reading this on a screen, powered by electricity from the grid – any idea where those materials came from?)
- the manner in which our planet bubbles and moves and puts vulnerable citizens at risk.
National boundaries are irrelevant for understanding Geoheritage: hence a global movement. And did the idea ever take off. Twenty years after that original idea, UNESCO is seriously looking into making Global Geoparks an official UNESCO program, which would give it a status like that of World Heritage.
Currently, the Global Geopark movement is a Network of Member Geoparks, the GGN. As the members emphasize: “it’s not just a list, it’s a network”. Member representatives get together in even years for a Global Geopark Conference and they gather for a regional Geopark Conference in Europe and Asia in odd years.
The first time a Global Geopark Conference was held in North America was last week, in Saint John (New Brunswick), the hub of Canada’s first Geopark: Stonehammer. And I got to go!

And while I knew quite a bit about Geoparks and the Global Geopark Network before I went, I had not anticipated the sheer force of passion that I would meet. This truly is a movement: here are thousands of people worldwide (there were nearly 500 at the Conference) who have found each other in the passion of promoting geoheritage as part of local or regional economic development and they are doing that under a globally recognized umbrella, the Global Geoparks Network.
The people that attend this conference aren’t only representatives of Global Geoparks – there are also representatives of Aspiring Geoparks, some of which are close to being to submit an application, for others it’s still a far-away dream. There were also representatives of UNESCO World Heritage sites, national and regional parks, etc.
It’s impossible to give you an exhaustive review of the conference (which was very well organized by the Saint John Stonehammer-folks), so here are some highlights, which I hope will illustrate what this movement is…. well… moving to.
First of all, there was the opening address by the Canadian Ambassador to UNESCO, Jean-Pierre Blackburn, who praised the Global Geoparks Network for carrying out a mission that is in line with the goals and objectives of UNESCO. His entire speech is here: Address Ambassador Blackburn Geoparks Conf (worth reading!).
Now for my impressions of Geoparks in various parts of the world:
I was impressed by the creativity of the English Riviera Geopark. They were established as a Global Geopark in 2007 and will host the next convention in 2016. This Geopark contains the area of Torbay between the cities of Torquay and Brixham in county Devon in South England. There are no fewer than 32 geosites within this Geopark! Interestingly, one of this Geopark’s initiators is Nick Powe, the proprietor and operator of Kent’s Cavern. So yes, Kent’s Cavern is privately run and Nick is the 5th generation (!) of the same family running this business! If that wasn’t special enough: Kent’s Cavern hosts England’s oldest human remains, dating back to the Neanderthals. The cave system has been subject to intense research for close to two centuries, but you can also host a birthday party or a wedding there.

Left: Nick Powe of Kent’s Cavern, one of the sites of the English Riviera Geopark. Right: English Riviera Geopark delegates – they also made music!
I had a fascinating discussion with Renato Ciminelli, president of the Quadrilatero Ferrifero Geopark, an aspiring Global Geopark in the State of Minas Gerais, Brazil. Minas Gerais is one of the world’s biggest iron ore producing regions, so there is lots of geology there, providing lots of traditional (mining) employment. But the local people are becoming uncomfortable with the idea that their only employment opportunity is through digging yet another hole in the ground – they need their home to be a living, breathing space and they want to diversify their economy. Enter the Geopark concept, which must be community-driven, bottom-up and non-governmental. Talking about a potential Geopark is giving these communities a vocabulary to express themselves about their future. A Geopark as a social change operator? One of the conference themes was: ‘engaging communities’……
I listened to a passionate talk by Farah Alam, who just completed her MSc in landscape architecture at Ball State University in Indiana (her thesis is here). She is from Hyderabad, and works with the Society to Save Rocks, a Hyderabad-based organization that aims to preserve and protect the spectacular 2.5 billion year old granite formations of the Deccan Plateau. The city of Hyderabad is booming and its glorious Monadnocks are blasted to bits to make way for the city. Farah explored whether establishing a Geopark could help the city grow in a sustainable manner without destroying what is essentially an important part of its cultural identity. She designed an inspiring and innovative interpretation centre and landscaping as part of her thesis requirements.
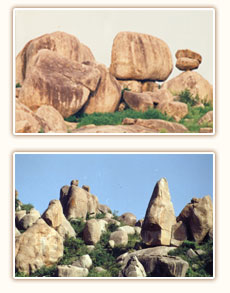 The granite landscape near Hyderabad.
The conference took place in the well-designed Saint John Trade and Convention Center, which also houses the city’s public library and the New Brunswick Museum. Its geology curator, Dr. Randy Miller, was one of the main drivers behind the Stonehammer Geopark. Adding to the spirit of the week’s most important event in Saint John was an international stone sculpting symposium that took place on the dock side in front of the convention centre.


Left: The bio of James Boyd, New Brunswick stone sculptor. Right: the work he created during the week of the Geoparks Convention.
I was immensely inspired by everything I saw and heard: the Global Geopark concept is an innovative tool for preserving geoheritage in a societal context. This is one of the better ideas ever. I predict that, 20 years from now, we’ll wonder how we ever did without this.
Onward Geoparks!
Canadian Earth Science for @PMHarper – 7: very old warm seas in what is now Nunavut (and why there is a Lead-Zinc ore body there)
The preamble to this review series is here. All reviews in this series are categorized as “Canadian Earth Science for @PMHarper” (see right hand column).
=====
Turner, E.C., 2009, Mesoproterozoic carbonate systems in the Borden Basin, Nunavut. Canadian Journal of Earth Sciences, v. 46, p. 915-938
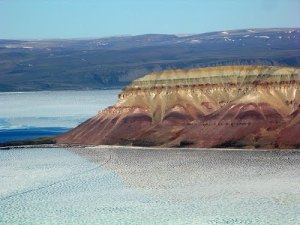
Figure 1. Borden Peninsula near Arctic Bay. Image Source: Google Earth
Canada has immense mineral resources. The Geological Survey of Canada (GSC), a branch of the Earth Sciences Division of Natural Resources Canada is responsible for most basic geologic mapping north of 60oN (and a lot more); the Provincial and Territorial Geological Surveys do all other basic geologic mapping (plus a lot more).
Why do we need basic geologic mapping? Because a geologic map (analog/digital) is the basis for justifying investments in developing and managing a territory as well as the basis for further fundamental geological research. Whether it is resource development, hazard mitigation, groundwater management, or any other human intervention in the land, a basic understanding of underlying geology is a necessary start.
This article is an outflow of a “North of 60” geologic mapping project, namely that of the Borden Peninsula of Baffin Island, Nunavut. The peninsula sits at 72-73o N and is essentially uninhabited, except for the small community of Arctic Bay.
The area under investigation is about 250 x 50 km large. Is it a priority to do geologic mapping all the way up there? Yes, because this area is rich in mineral resources: there is, or rather was, a Lead-Zinc mine: the Nanisivik mine. It operated from 1976 to 2002. The mine site has been cleaned up since 2007 and the community of Arctic Bay has been left with a mixed blessing (see further ‘Additional information’ below).
Finding natural resources is like a sophisticated treasure hunt: the first findings are the ones that stare you in the face. When those run out, you start scratching your head: would there be more? A better understanding of the different rock formations and their relations is then required. That’s what the original goal of this project was: improving understanding of the geological formations that host these ores.
But if you understand this ore-setting better, you can also improve your understanding of other Lead-Zinc ore bodies in comparable geologic settings elsewhere in the world (e.g. in Nova Scotia): studying comparable geologic sites increases the understanding of comparable (not: the same) mineral occurrences.
The rocks of the Borden Basin are about 1.2 billion (1,200,000,000) years old and the formations under investigation consist largely of limestone and dolostone. Limestone is Calcium Carbonate (CaCO3) and dolostone or dolomite is Calcium Magnesium Carbonate (CaMg(CO3)2).
Limestone can form in inorganically and organically. In the inorganic process, seawater evaporates in warm latitudes and shallow seas. As it evaporates, supersaturated carbonate precipitates around tiny grains of sand and the result are extensive and thick beaches and lagoons made up of ooids. This process has been going on for billions of years and is still going on today: most of the beaches on the Bahamas are made up of ooids.
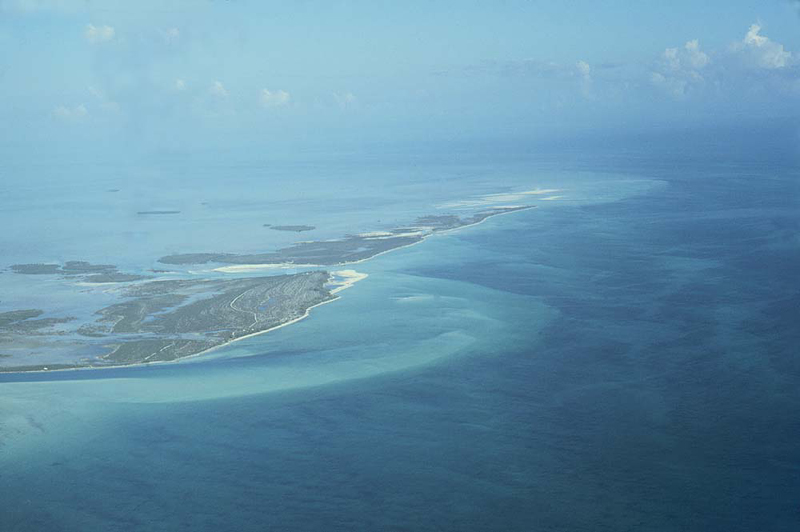
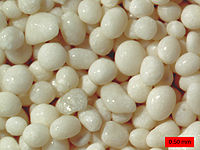
Figure 2. Ooids. Left: Joulter’s Cay, Bahamas – an extensive, thick carbonate platform made up largely of ooids. Right: ooids under the microscope. Each ooid is less than 2 mm in diameter.
But most marine limestone is formed as a result of biological processes: organisms build calcareous (CaCO3) external skeletons (shells, reef structures) by extracting dissolved carbonate from sea water. However: skeleton-building organisms did not exist 1.2 billion years ago – it would take another 600 million years for the first ones to evolve.
Some algae and bacteria also secrete carbonate, mostly in thin filaments that build on top of each other and look like tree rings when you see them in cross section. Algae and bacteria were pretty much the only living organisms back 1.2 billion years ago and some of these algae still exist today: they are called stromatolites and the most famous place where they occur is Shark Bay in western Australia, a UNESCO World Heritage site.

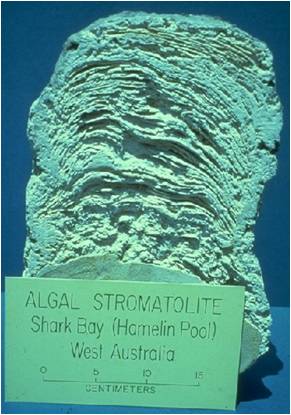
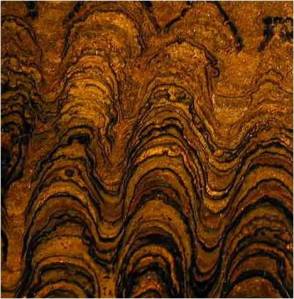
Figure 3: Stromatolites ‘algal mounds’. Left: people looking at stromatolite mounds in Shark Bay, western Australia. Middle: Shark Bay stromatolite cut in half. Right: 1 billion year old stromatolite, looking the same as modern-day Shark Bay stromatolite.
Earth was very different 1.2 billion years ago. Atmospheric oxygen was about 1% of today’s and the sun only had about 3/4 of its current strength. While scientists are still debating the details of the atmospheric and oceanic conditions of this era, there appears to be enough evidence to suggest that earth was relatively warm and could support lots of primitive life. Plate tectonics, the process of mid-ocean spreading, subduction and continent motion, was working too.
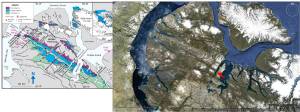
Figure 4. Left: Geologic Map of the Borden Peninsula (Turner, 2004a). Right: Google Earth image at approximately the same scale.
Let’s look at the geologic map of the Borden Peninsula and put a Google Earth image next to it (Figure 4). Stunning! The geologic map displays rock formations oriented in a NW-SE direction. The Google Earth image shows clear NW-SE lineaments. So yes: the structure (a geologic basin) in which these limestones precipitated 1.2 billion years ago is recognizable to the naked eye today.
The lineaments on the satellite image are indicative of the structure, i.e. the basin in which these limestones were laid down. The structure (faults) tell us that the basin was formed in a process called rifting. Because we know that plate tectonics was working then as it is today, you should imagine the environment being somewhat comparable to the Red Sea: a narrow seaway at a relatively low latitude (warm!). The Red Sea too is part of a (rather complex) rift system, lying at the upper extent of the East African Rift.
It gets better (what did we ever do before Google Earth?). Let’s fly to the area of the red arrow on the Google Earth image in figure 1 and drop our imaginary plane down:
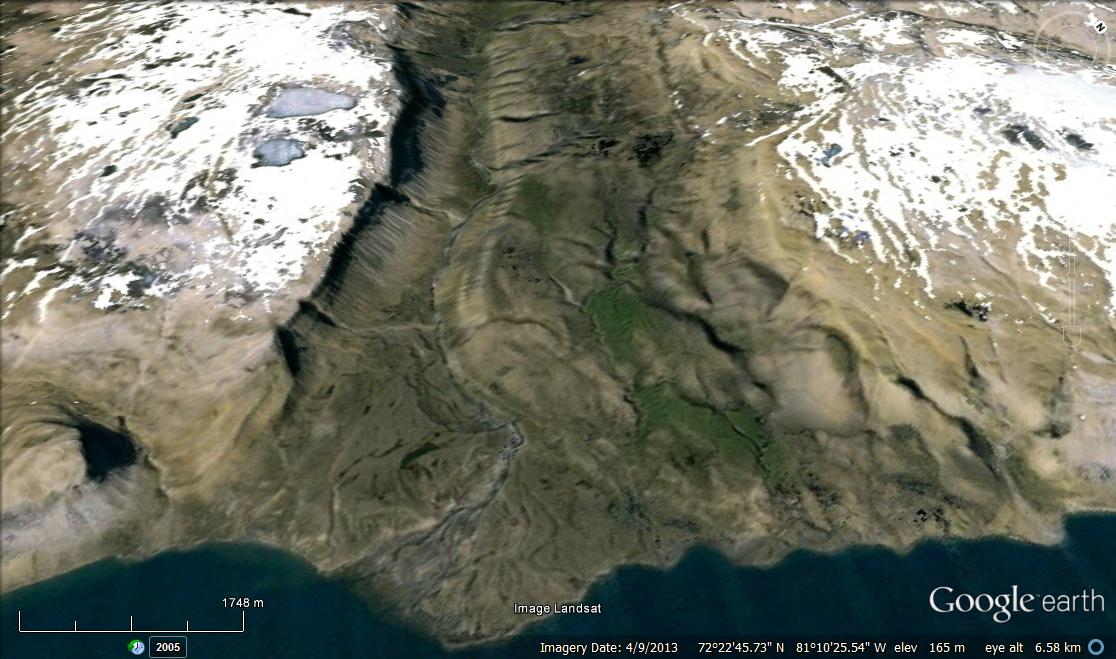
Figure 4. Google Earth close-up image of the area at the red arrow in Figure 1. The lineaments on the satellite image represent a distinct valley through which a river runs, building a small delta into Milne Inlet.
There you go: the relief we see today on far away Borden Peninsula reflects the remainder of the relief of 1.2 billion years ago. Pretty amazing.
During rifting, heat rises upwards from the earth’s mantle, forcing the earth’s crust to thin and sag, forming a rift basin. The floor and sides of the basin continue to experience high heat flow until rifting stops. When rifting stops, the basin stops opening and subsiding because heat flow was the engine for the rifting process.
The rising heat brings magmas closer to the earth surface as well. Such magmas contain all kinds of trace elements, including metals. In the Borden Basin, cracks (faults) in the rifting basin allowed for focused release of hot chemically charged plumes, which precipitated as mounds, surrounded by some filament-building algae. These mounds are where the Lead-Zinc complex is found today.
In short: in the shallow areas of this basin, extensive Bahama-bank like ooid shoals and beaches kept piling up as the basin floor subsided; in the deeper parts of the basin, concentrated heat flow caused mounds to build-up, incorporating metals and other trace elements.
So the immediate relevance of this mapping project was to locate and understand the ore-hosting formations. As a result, earlier named geologic rock units got renamed. Three new formation names were introduced and they all have Inuktituk names: The Ikparjuk (meaning ‘pocket’) Formation contains the isolated carbonate mounds that are the host of the Lead-Zinc complex. The other new Formation names are the Nanisivik (meaning ‘place where people find things’) and Angmaat (meaning ‘flints’) Formations.
The results of this project contributed to a better understanding of the Nanisevik Lead-Zinc ore body. In addition, much was learned about the ocean-atmosphere conditions during a very old and poorly known period in earth history: a practical question led to much fundamental knowledge that can be applied to other, comparable, geological problems.
This was an important paper: it became the most cited 2009 paper in the Canadian Journal of Earth Sciences.
Additional information on the Nanisivik mine:
The Nanisivik mine produced Lead (Pb) and Zinc (Zn).
- Lead: The global demand for Lead is still rising, despite the fact that the applications for toxic Lead are decreasing thanks to invention of substitutes. There is still significant demand for Lead in Lead-acid batteries. Read more about Lead here.
- Zinc: the following is from the USGS minerals database: about 3/4 of all zinc used globally is applied to galvanizing metal. The remaining 1/4 is consumed as zinc compounds mainly by rubber, chemical, paint, and agricultural industries. Zinc is also a necessary element for proper growth and development of humans, animals, and plants; it is the second most common trace metal, after iron, naturally found in the human body.
The Nanisivik mine had its own Arctic Port, which the Canadian Department of National Defence (DND) intended to upgrade and use as an Arctic fueling port. Significant ground instabilities appear to wreak havoc with those plans.
A 2002 report on the mixed-success legacy of the Nanisivik mine on the community of Arctic Bay can be downloaded here.
References
Hahn, K and E.C. Turner, 2013, Mesoproterozoic deep-water carbonate mound lithofacies, Borden Basin, Nunavut. Geological Survey of Canada, Current Research, 2013-11, 17 p.
Turner, E.C. 2003a. New contributions to the stratigraphy of the Mesoproterozoic Society Cliffs Formation, northern Baffin Island, Nunavut. In Current research. Geological Survey of Canada, 2003-B2.
Turner, E.C. 2003b. Lead-zinc showings associated with debrites shed from synsedimentary faults, Mesoproterozoic Society Cliffs Formation, northern Baffin Island, Nunavut. In Current research. Geological Survey of Canada, 2003-B2.
Turner, E.C. 2004a. Origin of basinal carbonate laminites of the Mesoproterozoic Society Cliffs formation (Borden Basin, Nunavut), and implications for base-metal mineralisation. In Current research. Geological Survey of Canada, 2004-B2.
Turner, E.C. 2004b. Stratigraphy of the Mesoproterozoic Society Cliffs Formation (Borden Basin, Nunavut): correlation between northwestern and southeastern areas of the Milne Inlet Graben. In Current research. Geological Survey of Canada, 2004-B3.
Turner, E.C. 2004c. Kilometre-scale carbonate mounds in basinal strata: implications for base-metal mineralisation in the Mesoproterozoic Arctic Bay and Society Cliffs formations, Borden Basin, Nunavut. In Current research. Geological Survey of Canada, 2004-B4.
Turner, E.C., and Long, D.G.F. 2008. Basin architecture and syndepositional fault activity during deposition of the Neoproterozoic Mackenzie Mountains Supergroup, N.WT., Canada. Canadian Journal of Earth Sciences 45: 1159–1184.
Granites, Glaciers and the Ocean: a hike
We hiked, the other day – a well-known coastal trail, but new to me. So much still to discover here and it’s not like we haven’t been trying. The trail is in Crystal Crescent Beach Provincial Park and takes the hiker all the way around the Pennant Point peninsula in about 4 hours.

Location of the Pennant Point peninsula, which sits as a veritable appendix off the Halifax peninsula. Inset: detail showing the tip of the peninsula (Pennant Point itself). Meaning of red star discussed below. Both images Google Earth
It’s an extraordinary beautiful area and wonderful for hiking as it hardly ever gets too hot or buggy thanks to ocean breezes and fog. The rocks and the landscape tell a fascinating story. It’s really too bad that there isn’t a single interpretive panel at the trail head.
The peninsula is exposed in striking almost-white granites and granodiorites (igneous rocks). They are peraluminous, meaning that their proportion of Aluminum oxide is relatively high compared to other granitic rocks. These granites are part of a large intrusive body, called the South Mountain Batholith. A batholith is a rock body that solidified from a molten magma as it cooled and moved upward towards the earth’s surface. A batholith consists therefore always of igneous rock and most batholiths are members of the granite family. Because of the excess Aluminum, peraluminous granites look very white, hence ‘leuco’ (meaning ‘light’).

Simplified map showing the extent of the South Mountain Batholith in Nova Scotia. Black arrow points to Pennant Point Peninsula. Total length of Nova Scotia is about 550 km.
The South Mountain Batholith rose and cooled in the Devonian, ca. 375 million years ago, a result of colliding continental fragments that pushed the Appalachian mountains upward. The batholith would still have been deep below the surface at that time, overlain by other rocks that formed significant relief, possibly up to 2000 m (Nova Scotia’s southern mainland is barely higher than 200 m today). These subsequently eroded away, exposing these beautiful granites.
The official geologic map of Nova Scotia shows that there are two types of granites here but these are indistinguishable to the casual observer:

Detail of official geologic map of Nova Scotia (MacDonald, 2001). The southern part of the Pennant Point peninsula is exposed in Monzogranites (legend M-L Dbmg), subtly different from the leucomonzogranites (M-L Dlmg) of the northern part of the peninsula, which are the same as those at iconic Peggy’s Cove.
Another striking characteristic of the granites of the South Mountain Batholith is that they contain lots of xenoliths. A xenolith is – literally – a ‘foreign stone’ (ancient Greek), a rock fragment torn from the rocks that surrounded the magma body as it rose, cooled, and solidified. Because that surrounding rock formation may have eroded away after emplacement of the batholith, xenoliths provide key clues about the area’s geologic history. Xenoliths can range in size from millimeters to tens of meters, as in Portugese Cove, a few kilometers northeast of Pennant Point
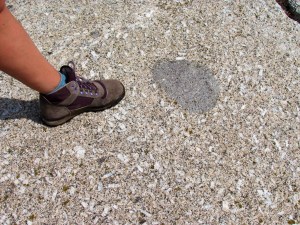
Xenolith (dark spherical rock fragment) in Pennant point granites. The white, somewhat aligned flecks are aluminum-rich feldspars that give the granite its distinctive light (‘leuco’) colour.
The South Mountain Batholith became exposed to the surface the several million years ago, so that it became subjected to the forces of Pleistocene glaciations. Several directions of ice movements are detected along these shores, but, in general, the ice moved away from ice domes situated over major land masses towards the sea (which stood on average 100 m below that of today). The ice caps, a kilometer or more in thickness, had tremendous erosive power. They smoothed the rock surface, and rock fragments that scraped the rock at the base of the ice cap left long grooves in the granite, indicative of the direction of ice flow.

Granite outcrop at Pennant Point with glacial grooves (called ‘striae’) indicating the direction of the ice flow (look close: they are parallel to the added red line). The ice cap both smoothed and scratched the rock surface
When the ice melted away, many of rocks that were incorporated in the ice flows, were left stranded. These are called ‘erratics’. While most erratics in this area consist of the same granite as the outcrop, erratics may have traveled hundreds of kilometers, thus leaving important clues for reconstructing the origin and direction of Pleistocene ice flows.

Glacially smoothed granite surface with glacial erratics (same granites) at Pennant Point.

Along the eastern side of the Pennant Peninsula
Then came the people
Sadly but not surprisingly, we found an immense amount of sea-borne trash on our hike. Other than the usual macerated lobster traps, buoys, gasoline cans and fishing lines, the most impressive piece was a massive 30ft piece of a wharf that rested at the red star at the top of the lake in the Google Earth image, nearly 100 m from the water edge. There was a lot of other trash around the perimeter of the little lake in the image (a.o. a Canadian Coast Guard buoy that was spilling styrofoam mini-pellets), but this was definitely the biggest piece. The assembly of trash and their location clearly shows that this lake and its boulder-rubble seaward edge is a classic storm washover feature, created by repeated battering and overwash from massive storms and hurricanes. Somewhere is a community with a big repair bill. Everywhere are all of us, “planet earth astronauts” (thank you Chris Hadfield) with an even bigger repair bill: that of the maintenance and repair of our fragile and only home.


30 ft piece of a wharf, resting at the red star in the Google Earth image. Red dashed line indicates washover feature. Other washovers can be seen on the left ![]() side of the point. Red star is nearly 100 m from the sea
side of the point. Red star is nearly 100 m from the sea
References
Clarke, D.B. and S. Carruzzo, 2007, Assimilation of country-rock ilmenite and rutile in the South Mountain Batholith, Nova Scotia, Canada. The Canadian Mineralogist, v. 45, pp. 31-42.
MacDonald, M.A., 2001, Geology of the South Mountain Batholith, southwestern Nova Scotia. Nova Scotia Department of Natural Resources, Open File Report ME 2001-2
Posted in General geoscience, Geoheritage, Nova Scotia
Tagged Atlantic, batholith, Canada, continent break-up, earth science, geology, geoscience, granite, Ice Age, Nova Scotia, Quaternary, Sea Level
1 Comment
The graphic artist M.C. Escher and his connections with geology

Left: Mobula Rays off Baja California by Eduardo Lopez Negrete / National Geographic. Right: “Two Fish” by M.C. Escher, 1941 from Escher official website
The left-hand photograph circulated on Twitter a few weeks ago and someone commented that “it looks Escheresque”. I found that fascinating: an apparently random natural phenomenon reminded someone of the mathematically composed artwork of the great graphic artist M.C. Escher.
We now know that there is a lot less “random” in the natural world than we thought there was roughly half a century ago. M.C. Escher (1898-1972) died before Mandelbrot published his work on fractal mathematics in 1979. Mandelbrot demonstrated that much of the apparent randomness that we observe in nature is the result of relatively simple mathematical relations, controlled by what is called a ‘strange attractor’. The best treaty on fractal mathematics and chaos theory for non-mathematicians is James Gleick’s ‘Chaos’. I read ‘Chaos’ more than 20 years ago and it completely changed my view on my work, my career and subsequently my life.
For many centuries before Mandelbrot people wondered “only” about symmetry in nature. Everyone observes symmetry and its exceptions, beginning with our own body which appears symmetrical but isn’t: two legs, arms, eyes, ears, lungs, kidneys but one mouth, esophagus, heart, liver, spleen, pancreas, bladder.
The foundations of crystallography and mineralogy are mandatory in every geoscience degree. We learn about molecular lattice structures and resulting crystal form. Depending on molecular lattice structure and resulting crystal structure, some minerals appear perfectly symmetrical, such as a cubic pyrite. At the other extreme is e.g. triclinic plagioclase, which is symmetrical in a more complex way.
. 
Left: cubic pyrite. Right: triclinic plagioclase. (Wikimedia)
Maurits Cornelis (“Mauk”) Escher was fascinated, or maybe obsessed by ‘the systematic compartimentalization of space’ (in Dutch: “regelmatige vlakverdeling” as he wrote in a letter to his nephew Rudolf, a composer.
M.C. Escher’s half brother was Berend Escher (1885-1967), a professor of geology at Leiden University in the Netherlands, whose specialization was crystallography, mineralogy and volcanology. Berend Escher was also the sole author of the next-to-last introductory geology textbook in Dutch. The annual MSc-thesis prize, awarded by the Royal Netherlands Geological and Mining Society is named in his honour (full disclosure: I initiated the prize and was chair of its first jury but I didn’t name it).
‘Grondslagen der Algemene Geologie’ (Foundations of Introductory geology) by B.G. Escher, 1948 (my copy).
Berend Escher’s textbook doesn’t contain a chapter on crystallography nor one on mineralogy. As an expert in that field, he decided that this subject was too big for just a few chapters in a textbook and in 1950 he published a separate textbook entitled: “Algemene mineralogie en kristallografie” (“Introductory mineralogy and crystallography”). When I first published this post, I wrote that I don’t have a copy of that book nor had I ever seen it. My writer brother read my post and bought me the book! Here it is:
Did Berend and M.C. (Mauk) Escher exchange thoughts on crystallography and mineral structure? I bet they did. I bet they wrote letters to each other, but if they did, we don’t know about them. We do know that Mauk was a letter writer, because I have a fascinating book with a collection of letters between Mauk and his nephew Rudolf Escher (Berend’s son), who was a composer. And Mauk designed an ‘ex libris’ book stamp for his brother Berend, paying homage to his expertise on volcanoes.


Left: Rudolf Escher and M.C. Escher “Beweging en metamorfosen, een briefwisseling” (‘movement and metamorphosis, an exchange of letters). 1985 – my copy. Right: Ex Libris for Berend Escher, designed by M.C. Escher
Mauk Escher explored symmetry in an illusionary manner his whole artistic life. This is not a treatise on that subject, which is too big for one blog post. I include only one illustration here. It is highlighted in “From 2D to 3D: I. Escher drawings crystallography, crystal chemistry and crystal defects” by Peter R. Buseck of Arizona State University, a downloadable 12-page document. Peter Buseck used Escher’s images to teach about symmetry by designing puzzles about them. Here’s one:


Left: M.C. Escher, 1942, Pattern #55 “Fish”. Centre: with lines indicating symmetry (drawn by me). Right: symmetry lines only, immediately showing 3-dimensionality.
I took crystallography and mineralogy at Groningen University in the Netherlands from professor Perdok, who impressed upon us (among other things) “that a 2-dimensional space cannot be filled by pentagrams except by Escher”. But I also I grew up in the town of Baarn, the Netherlands, where Mauk Escher lived during the last 20 years of his life. When my high school got a new building in 1968, the school commissioned Escher to design pillars for the school’s lobby – these Birds and Fishes pillars became iconic and were moved to the school’s latest building a few years ago.
M.C. Escher’s oldest son George was an engineer and moved to Canada early in his life. He lived for a long time in Mahone Bay, just an hour from where I live now. He donated his personal collection of his father’s works to the National Gallery of Canada, giving them one of the largest Escher collections in the world. On that occasion, he talked about his father. M.C. Escher’s two younger sons became geologists, Arthur in France and Jan in Switzerland.
Why do we continue to be so fascinated by Escher? For one thing, I think that it’s because he shows us something that science alone cannot show us in the same manner: beauty, wonder and unpredictability.
Just one reason why we always need more Art in Science.
Posted in Geoscience and Art
Tagged Art, Canada, crystallography, geology, M.C. Escher, mineralogy
2 Comments
#Mywritingprocess blog tour: clicking “publish” is exhilarating
This post is not about Earth science, it’s about me. This is part of a relay race: an exploration into how and why people blog about science. Search for #mywritingprocess on Twitter and you find hundreds of bloggers who have tackled this relay.
The idea is to answer a few questions and pass the baton.
I would not have participated in this exploration if I had not been handed a baton, and – in a moment of sheer madness – accepted it. So now I must do my part and pass it on.
Step 1 – who tagged me?
I was tagged by Sarah Boon, who blogs on blogging, nature writing, snow hydrology, mental health and photography. Sarah’s blog is also part of Science Borealis (in fact, Sarah is the genie behind Science Borealis), where my blog humbly also finds a home. I have never met Sarah in person, but we have built up a friendship of sorts in virtuality and I enjoy her writing and admire her frankness.
Step 2 – Answer Four Questions:
a) What do you generally blog about?
The title of my blog pretty much defines its content: Earth, Science and Society. I am a sedimentary geologist, but am more interested in where earth science intersects with societal issues than in the science itself (I was a prof once, but Academia was not for me: I resigned from a tenured position). I find that too much writing on the management of our one and only planet uses humanity as the vantage point instead of the planet itself and that irk has been with me pretty much since grade 8. One of the quotes in my school diary that year (I don’t remember the author) went something like this: “nature scoffs at human suffering and only considers her own greatness”. I suppose it was only logical that a child growing up in an outdoorsy family of avid readers would be interested in earth science and writing. My life long fascination with that quote motivates my writing.
Occasionally I take a side road and write about women in (earth) science or about science and art (stay tuned – my next post will take you there).
b) how does your blog differ from others’ blogs in the same genre?
I really don’t have a good answer to that question. Most earth science bloggers that I follow a bit use their blog in the context of their work, as for example Dave Petley, Matt Hall and Evan Bianco at Agile, or the Deep Sea Discovery teams on the JOIDES Resolution. I suppose each blog is pretty unique, because blogging is more personal than any other form of publishing. I am not going to dare a comparison.
c) why do you write what you do?
My professional career is winding down. Way back when I was a student, I had dreams of being a science journalist, inspired by the superb weekly science special of my favourite newspaper. Then I became utterly fascinated by my own profession, realized that writing was very very hard and that I didn’t have a natural ability for it. Next I moved to the US and had to learn to write scientific papers in my second language. Simultaneously with all that came the parent phase. But now life is balanced and I have time. If you have learned something, you must share it (thank you, Maya Angelou). I have learned a lot, so I am trying to go back to that dream. There is no excuse – the blogosphere is out there.
d) how does your writing process work? how do you decide what to blog about? What is blogworthy to you?
I aim to write two blog posts per month and that turns out to be a tall order. One monthly post is on whatever hits me, the other one is part of a series of reviews under the header “Canadian Earth Science for @PMHarper”. The argument for writing this series is here. My aim is to cover the breadth of Canadian Earth Science both in terms of content and authors. It should run for another year or so. Selecting an article is not very spontaneous, I keep a spreadsheet of topics and authors to help me map a balanced progress.
I think a long time about how to tackle an issue and where to start. It takes me forever. Without the structure that I dictated to myself, I think I would quickly give up. Too hard! But I do want to. Clicking “publish” is exhilarating.
I have never taken a writing class, but I have had some very tough editors. I write in my second language. These are two distinct disadvantages. I do hope to enroll in a science writing course some time in the not too distant future. Writing is incredibly hard, but I want that challenge.
Step 3: Tag another writer or 2 to answer the questions the week after you. Give a one-sentence bio of each, and link to their websites
I am tagging Graham Young of Ancient Shore, the other Canadian earth science blogger on Science Borealis. He is curator of geology at the Manitoba Museum.
Canadian Earth Science for @PMHarper 6 – Would CO2 storage in deep saline aquifers carry an environmental risk for shallow aquifers?
The preamble to this series is here. All reviews are stored in the category “Canadian Earth Science for @PMHarper” (see right hand column).
=====
Lemieux, J.-M., 2011, (Review:) The potential impact of underground geological storage of carbon dioxide in deep saline aquifers on shallow groundwater resources. Hydrogeology Journal, v. 19, p. 757-778. DOI 10.1007/s10040-011-0715-4
The world is warming up and humanity is the cause: we have become a geologic force, and have brought in the age of the Anthropocene. As President Barack Obama stated so eloquently in his commencement address at the University of California at Irvine last week “the question is not whether we need to act; the overwhelming judgement of science, accumulated and reviewed over decades, has put the that to rest. The question is whether we’re willing to act.”
There are numerous possibilities for action, depending on technology and political will.
The carbon dioxide content of our atmosphere now stands above 400 ppm (parts per million) and even if we all had the best intentions and started to intervene tomorrow, we simply can’t stop burning fossil fuels right away, so atmospheric CO2 will continue to rise for a long time to come.
What if we captured some of that carbon dioxide at the source (i.e. industry) and put it back in the ground before it reaches the atmosphere, thus slowing down the rise in atmospheric CO2? This process, known as Carbon Capture and Storage (CCS) – has been tackled by scientists and engineers for only just over 20 years, i.e. ever since the risk of global warming first began to be taken serious by a handful of people. Imagine that everyone had been a climate-change skeptic back then, we wouldn’t have known anything about this subject today! Here is the official (and excellent) Canadian CCS site.
Over the years, I have heard more than one climate-concerned citizen say that we should ‘just put all that CO2 back where it came from’. If only it was that simple, the process would have been routine now, pretty much like taking lead out of gasoline or CFCs out of spray cans.
This article reviews the State of the Art of our knowledge about CCS in deep saline aquifers. That knowledge is impressive but also discouraging. There are still so many unknowns!
So what, exactly, are the challenges?
First: there are only a few possible properly contained subsurface reservoirs for CCS: 1) depleted oil and gas fields, 2) unminable coal beds and 3) deep saline aquifers. This review focuses on this last and preferred option.
Why not the first two options? CCS would be the most efficient and effective if every major (energy) industry (a ‘point source’) could inject CO2 in the subsurface. But not all of Canada’s heavy industry nor its powerplants are located above oil and gas fields or unminable coal seams. Some depleted oil and gas fields are already filled with re-injected CO2 as part of the process of producing the field (a process called ‘well stimulation’). So while those first two options are heavily researched and tested (see for example here and here), it would be better if we could access a rock compartment that is pretty much present everywhere.
Deep saline aquifers are present just about everywhere and are therefore the preferred choice.
Let’s take a look.
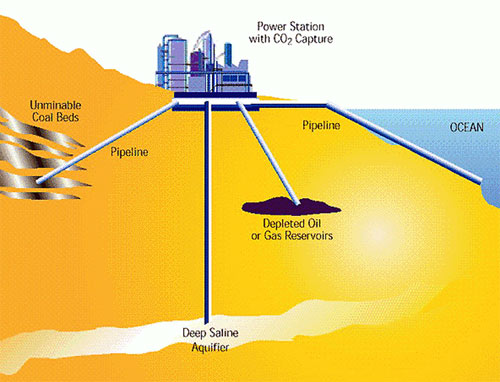
This diagram shows the different possible natural reservoirs for CO2 storage (source of figure). There is no vertical scale indicated, but deep saline aquifers are located at close to 1 km depth, far below the aquifers from which we draw water for human use.
It is important to note that CO2 occurs naturally in deep saline aquifers (and has been plentiful in such aquifers for millions of years) so that re-injecting it in such an environment mimics a natural process. Naturally occurring chemical reactions (given the right temperature and pressure) in such an environment may turn CO2 into limestone and/or related minerals , but because pressure in these aquifers is very high (because they occur at great depth), CO2 often stays dissolved in the water.
CO2 (or any other gas) will only stay in the aquifer-reservoir that reservoir is properly sealed. The seal is provided by surrounding rock that is impermeable. A typical example of impermeable rock is salt or gypsum. But even such rocks have cracks and/or are broken up by faults. Cracks and faults can lead to leakage from the reservoir rock. This also is a completely natural process, but if we want to store CO2, we want it to stay in the reservoir and not leak back to the atmosphere.

Gypsum outcrop, riddled with smaller and larger cracks. Yet gypsum is most of the time an excellent reservoir seal.
Another potential risk is that dissolved CO2 can change the acidity of the deep aquifer. A different acidity may cause certain trace elements, such as the toxic elements lead and arsenic, to become mobilized and travel to the shallow aquifer (which is what we use for drinkwater and irrigation). We don’t want that either.
Also, you must be able to take into account that certain effects of CO2 injection will only be noticable far away from the injection site, whereas other effects are realistic near the injection site. The difference is explained by the the architecture of the subsurface. “Architecture” refers to the manner in which the rocks are layered, tilted, folded, faulted and (re)cemented. Each rock formation has a completely unique architecture (this is what keeps geoscientists busy). These effects are called ‘near-field’ and ‘far-field’ effects.


Examples of different archecture in rocks. Left: ‘layer-cake’ beds. Right: complex folding
If we store CO2 in the deep subsurface, we want it to stay there ‘forever’. How long is forever? Not a single geologic formation stays unchanged forever, but some experience millions of years of utter boredom. Can we predict the rock formation with the most boring future? Keep in mind that the earth cannot things boring forever. Our planet bubbles and burps and sighs and heaves according to the 2nd law of thermodynamics, which dictates that every system always turns to maximum randomness. In the end, any sort of reservoir will come undone.
Long term geologic processes can affect deep groundwater flow significantly, a concern that has affected the research on deep storage of nuclear waste to the point where that has just about become a dead end. And – really weird question, but let’s face it: if we would be able to take significant amounts of CO2 out of the atmosphere, do we want to be able to put it back when the next ice age hits (if humanity is still around)?
It’s these sort of questions and uncertainties that have been the topic of intense research and it’s this research that is reviewed in this article.
How do you research this? Ideally, you should sample and research the reservoir itself, but that’s more or less impossible because it’s so deep. There are two other ways: 1) carry out experiments, in a lab or in super-controlled natural situations and 2) through numerical modeling and simulations (thank goodness for ever more powerful computers). This research is complicated and expensive. The real-world experiments have to run a long time before yielding data that can be understood and extrapolated.
This is what makes this article both discouraging and impressive: such fantastic research and yet so many remaining questions. The author has defined a number of knowledge gaps. He begins by stating that the state of understanding is very immature because quantitative research is no more than 10 years old. Laboratory experiments that study the interaction of minerals and CO2-saturated brines are few and far between. Most numerical models are still very simplistic (that’s mostly determined by not having sufficiently sophisticated computers, we still need better ones, yes we do).
But he ends on a positive note: despite the above, the possible environmental impacts of geologic storage of CO2 in deep saline aquifers on shallow groundwater resources appear to be low. Given proper understanding of the reservoir, leakage of harmful elements or of CO2 itself, can be minimal.
So: while more research is needed, the technology is promising. Let’s hope it will take off.
Currently, CO2 is injected in deep saline aquifers in a number of experimental sites: Sleipner (offshore Norway), Weyburn (Saskatchewan, Canada), Frio (Texas, USA), Midwestern States (USA).
Writing a review article is a big job. The job that led to this article was commissioned by the Geological Survey of Canada. The result is a body of work that serves the interest of all Canadians.
Canada’s Geoheritage Surge: Geoscience Heritage, Geoparks, Geosites, Geotourism
UPDATE – OCTOBER 20 2014.
It’s here! “Four Billion Years and Counting: Canada’s Geologic Heritage”. Offered to you by the Canadian Federation of Earth Sciences for CAD$39.95 only – order your copy from Nimbus

—
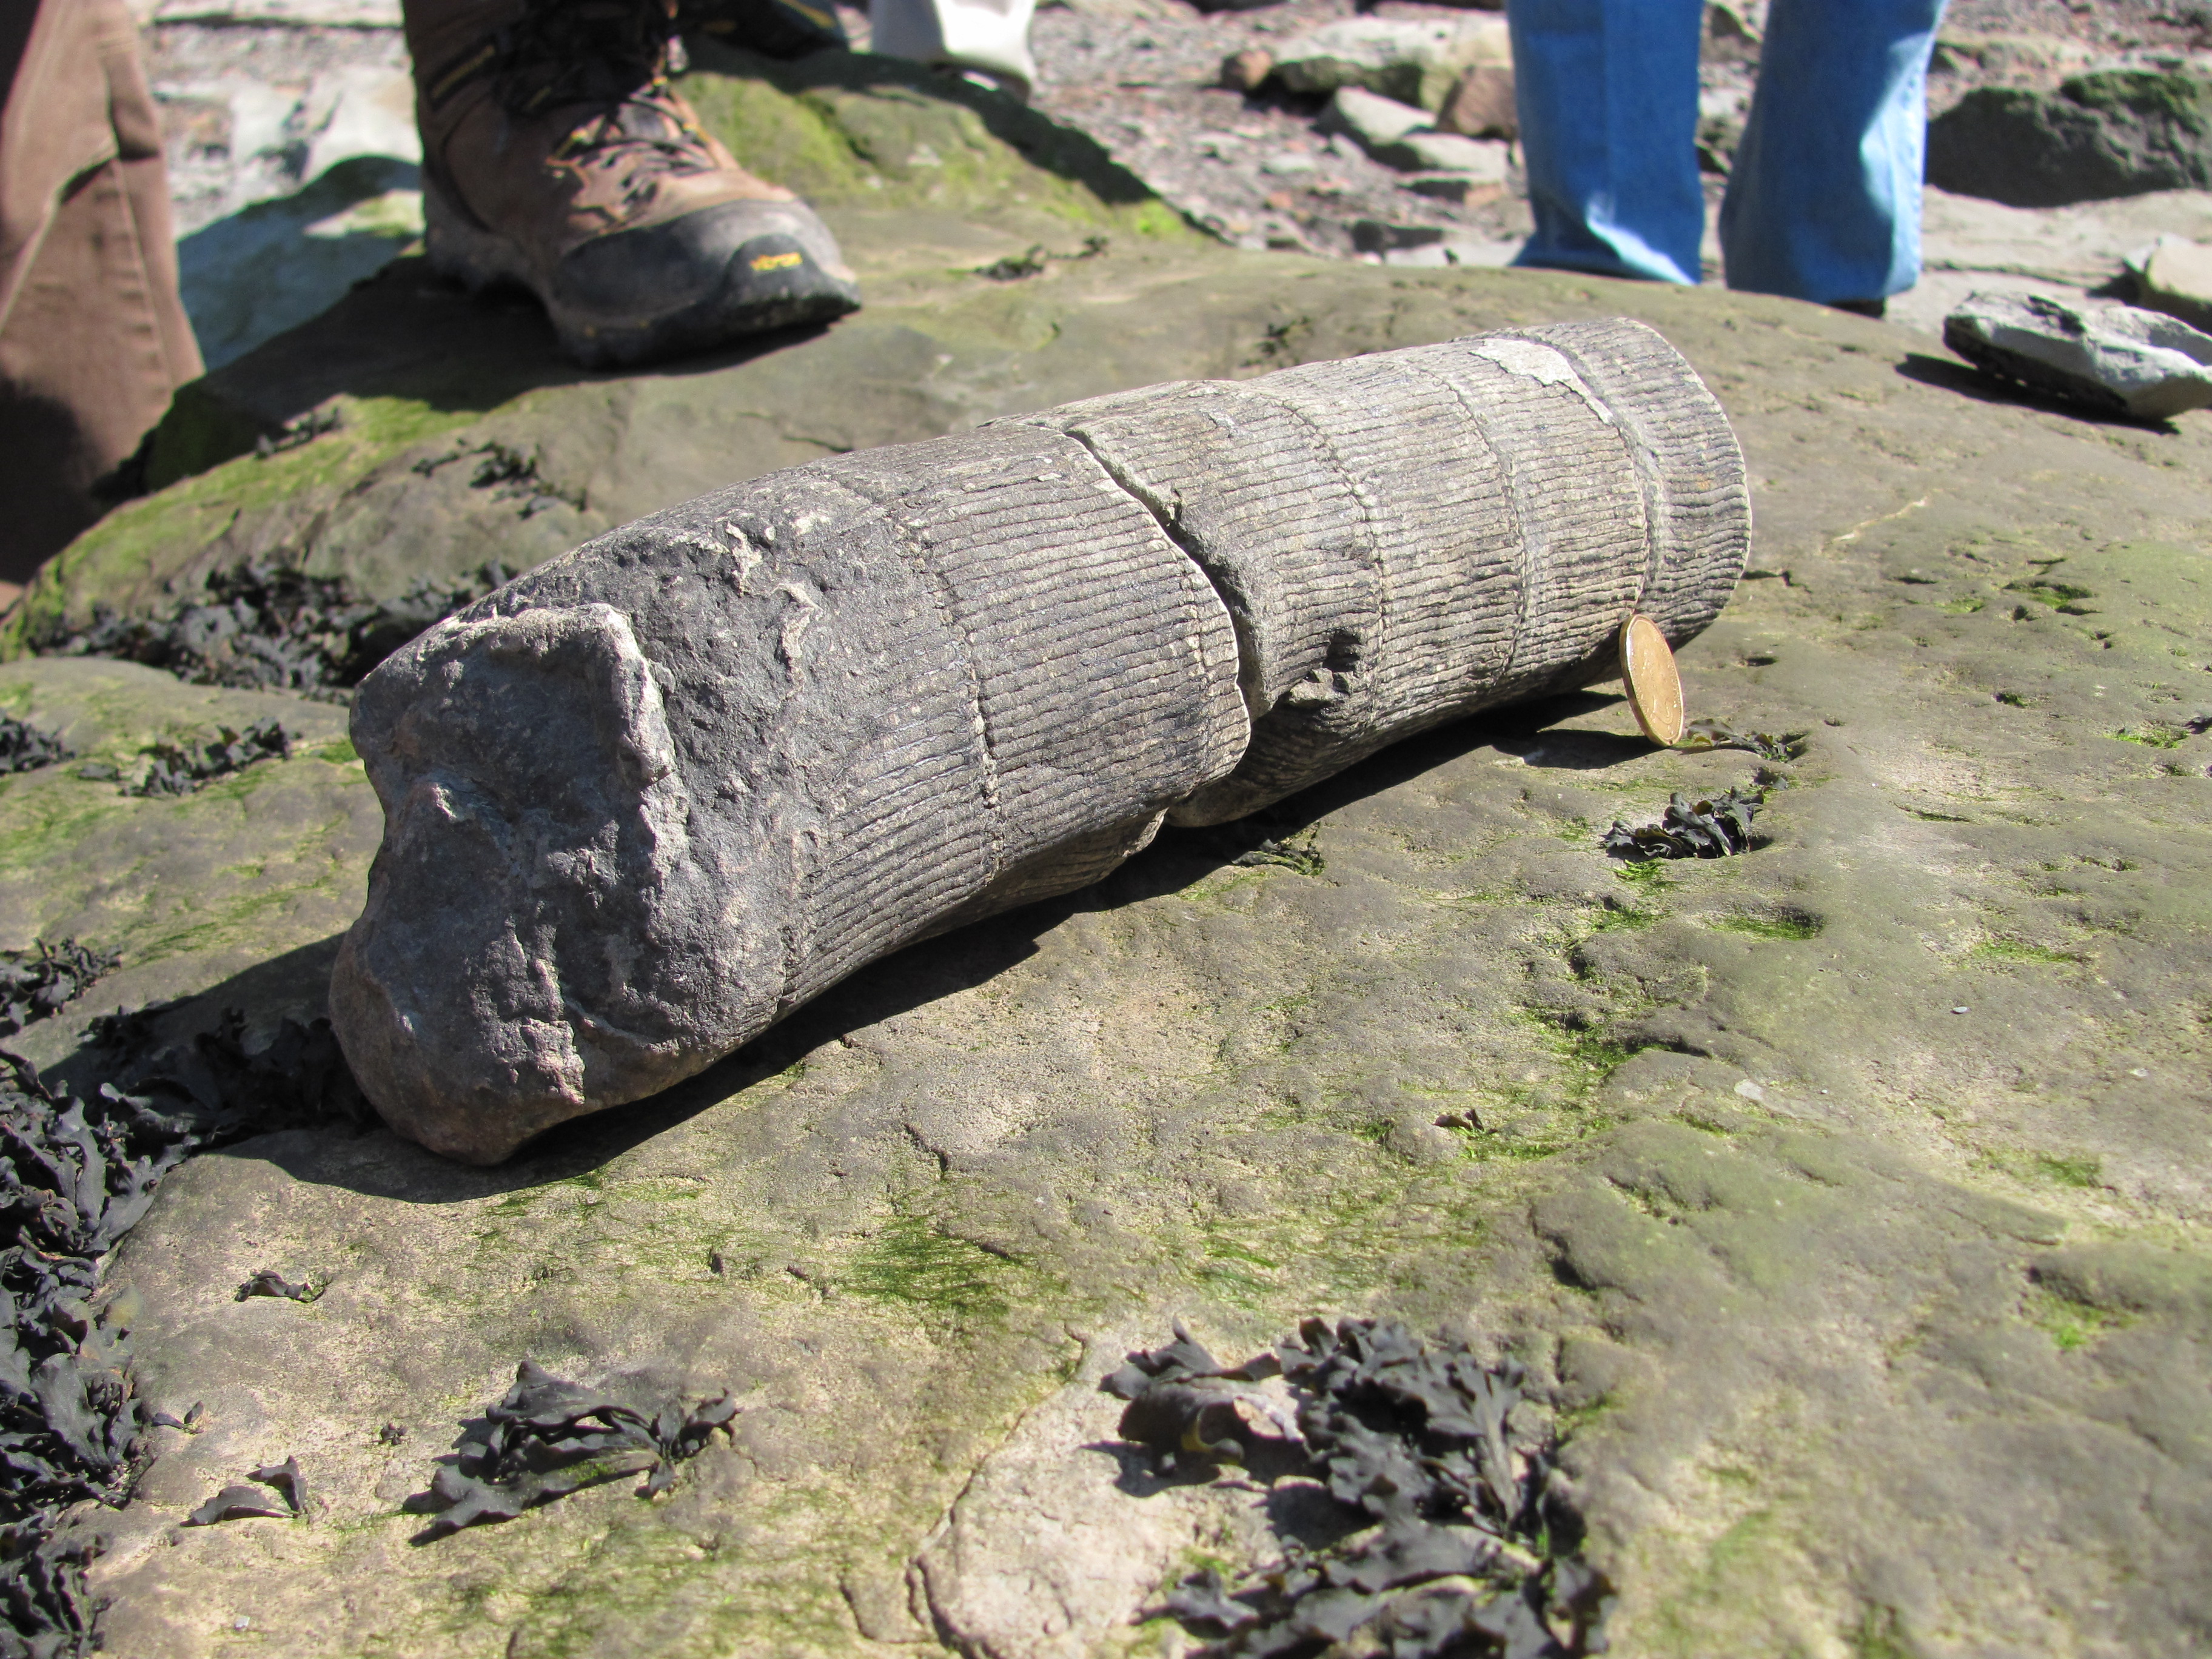
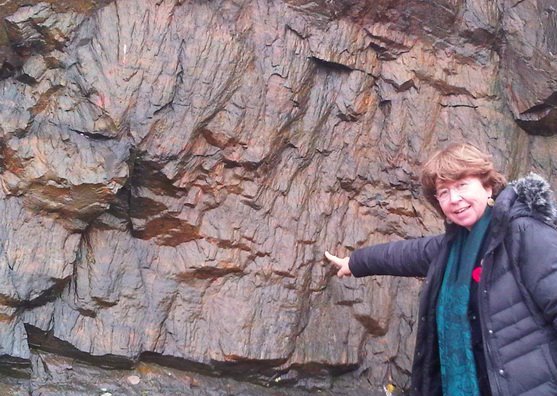 Left: A fossil tree at the Joggins Fossil Cliffs UNESCO World Heritage Site (NS, Canada). Right: 1.8 billion year old shatter cones (result of an asteroid impact) at Sudbury (ON, Canada – photo Andy Fyon)
Here is a commonly heard complaint: “most citizens don’t know anything about earth science, because it’s not taught in school (and – in extension – therefore citizens don’t know the first thing about earth materials, natural hazards, climate change – fill in the blanks). I don’t buy that. A lot of subjects are not taught in school and most people are not completely ignorant about those (criminal law, orthopedic surgery, etc.).
There is earth science in the secondary school curriculum in Canada, although not a lot. I would love it if there was more, but then other subjects would have to give, and I ask you which ones? Imagine the endless battle that would ensue. Not worth the energy. An unproductive exercise.
But why makes this a problem? We have the whole planet for a lecture room! Just stick your nose out the door, and there is something to learn about the earth, no matter where you live or travel. Put up a sign, build a trail, an interpretation centre, write a book or develop an app.
And that’s exactly what’s been happening slowly but surely over the last 15 years or so. I call it the Geoheritage surge. I’m not going to write its biography, but I thought it might be useful to list what we have in Canada. And – please! – if you see an omission, tell me and I’ll happily add it!
Also – I don’t really care what we call it. The term “Geoheritage” is popular here in Nova Scotia, because the province is in the process of creating a list of sites, which they call a Geoheritage list (more about it further below). Elsewhere in Canada people prefer the term “Geoscience Heritage” to treat the concept in parallel with built Heritage. “Geosites” is used somewhere else again – simply indicating a place where worthwhile earth science can be observed. A “Geopark” is an area that meets certain criteria of the Global Geopark Network (more about this also below), etc.
Really, it doesn’t matter. Any initiative that celebrates places that teach citizens about earth history and earth materials, about the history of dealing with the earth and its materials (historic mines for example), it doesn’t matter. Any site that can be a destination for a field trip.
So here goes:
Canadian organizations that do earth science outreach
The Canadian Geoscience Education Network (CGEN) “is the education arm of the Canadian Federation of Earth Sciences (CFES). CGEN is concerned with all levels of geoscience education in Canada and encourages activities designed to increase public awareness of geoscience”. CGEN is 100% volunteer-run and they are particularly focused on school teachers. CGEN has also developed the “Careers website” and the “Where Challenge” and coordinates EdGeo. EdGeo is responsible for organizing 1-week workshops and field trips for science teachers in the summer across Canada. The CGEN website has a separate page with resources especially for teachers, but it’s interesting for everyone who wants to know more.
This special 2009 issue of the “Geoscience Canada”, the Journal of the Geological Association of Canada, on geoscience outreach pioneer Ward Neal is open access (as are all their issues prior to 2011)
And here is a 2012 report on Canada’s Geoheritage efforts from one of Canada’s geoheritage champions, published in a CFES newsletter (a wonderful publication that seems to have expired).
Museums and interpretive centers: Fifteen museums and natural heritage centres cooperate and communicate efforts in the Alliance of Natural History Museums of Canada. In addition, there is: the Royal Tyrrell Museum in Drumheller (dinosaurs!) – see below.
Globally recognized Canadian sites
The UNESCO World Heritage designation is one of the world’s most prestigious. There are cultural and natural World Heritage sites. Canada has 17 UNESCO World Heritage Sites, of which 9 are natural sites and 8 are cultural sites. Of the natural sites, no fewer than 6 have been designated largely or exclusively because of their Geoheritage. These are:
- Canadian Rocky Mountain Park (AB/BC), which includes the late Precambrian Burgess Shale site and the dramatically fast retreating Athabasca glacier complex
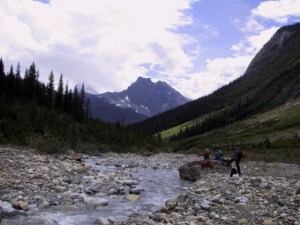
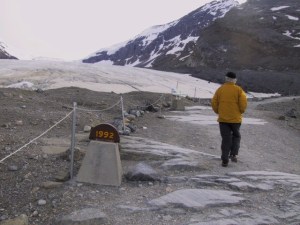 Left: Mt Wapta, the site of the Burgess Shale Quarry in the distance. Right: the toe of the Athabasca glacier (in 2005) with a marker indicating its position 13 years earlier.
 - Dinosaur Provincial Park, home of the amazing Royal Tyrrell Museum – your best destination for cutting edge knowledge on Cretaceous dinosaurs.
 Left: Albertosaurus model at the Royall Tyrrell Museum. Right: Horseshoe canyon near the Royal Tyrrell Museum: quick erosion helps to uncover Cretaceous fossils.
 - Gros Morne National Park, which includes the official Cambrian-Ordovician Boundary at Green Point and the Precambrian Woody Point and Table Mountain ophiolite.
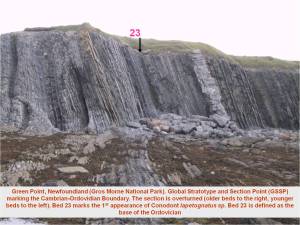
- Joggins Fossil Cliffs, “the Coal-Age Galapagos” – a complete early Carboniferous coastal plain ecosystem that includes upright fossilized trees (picture at the top of this blog page).
- Miguasha National Park, representing the Devonian “Age of Fishes”.
- Kluane/Wrangell-St.Elias/Glacier Bay/Tashenshini-Alsek National Park, an impressive collection of modern glaciers on the Canada-US border.
Global Geopark Network
![]()
![]()
Left: The logo of Stonehammer Global Geopark, located around Saint John, NB. Centre: the logo of the Global Geoparks Network. Right: the logo of the brand new Tumbler Ridge Geopark in BC.
The Global Geopark Network was initiated under the umbrella of UNESCO but is not a UNESCO Program. It goes too far here to explain the difference. The important thing is that Geoparks are becoming popular venues for attracting tourists to geoheritage sites. Geoparks have sprouted like mushrooms in Europe and Asia (especially China and Japan), but not (yet) in North America where the only two recognized Global Geopark are Stonehammer Geopark, centered around Saint John (New Brunswick) and Tumbler Ridge Geopark in northern British Columbia. The Global Geoparks Conference 2014 was held in Saint John (see my post about that meeting here).
Stonehammer Global Geopark became enscripted in 2009 and celebrates a billion years of geoheritage through 12 sites in the greater Saint John area, which you can explore on foot, by bicycle in a kayak, or by ziplining!
Tumbler Ridge Global Geopark became official in September 2014. The town was only incorporated in 1981 when it grew up around a coal mine. When that closed 20 years later, the town went in decline, but then Dinosaur trackways were found and now the town is hoping to reverse its economic decline through its Geopark status.
There are efforts to create more Canadian Geoparks – these efforts are coordinated through Canada’s National Geoparks Committee, which vets Canadian Geoparks before the application is sent off to the Global Geopark Network for approval. The 2014 Global Geopark Conference (where Tumbler Ridge was voted in) took place in Saint John and I wrote about it here.
Provincial Geologic Highway maps
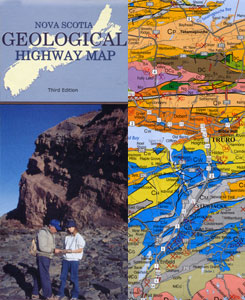
Geologic Highway maps are designed especially for the general public. They feature a (simplified) geologic map of the jurisdiction with the main highway system and notable stops with lots of explanation. They are still only in paper (or downloadable) format and badly deserve to be morphed into apps:
Geologic Landscapes highway maps of Northern and Southern British Columbia
What is the Yukon Territory made of? A wonderful publication – free downloadable pdf!
The Geologic Highway Map of Alberta can be ordered here
The Saskatchewan Geologic Higway Map can be ordered here
A geologic highway map for Manitoba is in the making
A geologic highway map for southern Ontario can be downloaded here and the one for northern Ontario is here.
The New Brunswick Geologic Highway map is out of print (I have one, it dates back to 1985 and really really deserves a new edition).
The Nova Scotia Geologic Highway map (pictured above) is a gem and can be ordered from the Atlantic Geoscience Society.
The Traveller’s guide to the Geology of Newfoundland and Labrador can be ordered here.
I could not find a geologic highway map or similar publication for Quebec, the NW Territories, Nunavut or Prince Edward Island. I hope that’s me – tell me!
Individual examples of geoheritage initiatives and communication across the country
British Columbia: Tumbler Ridge Dinosaur trackway and museum – Do note the comment below by Lisa Buckley, paleontologist at this museum. She lists the top 5 Fossil sites in BC
Yukon: The Yukon Beringia Interpretive Centre and The Dawson City / Klondike Gold Rush National Historic Site
Alberta: The Earth Sciences Department of the University of Alberta has an outdoor rock interpretation garden
Ontario:
The Ottawa Gatineau Geoheritage Project promotes greater public knowledge and appreciation of the geology and related landscapes in and around Canada’s National Capital Region.
The Carleton University Department of Earth sciences has an active outreach coordinator: lots of information and events in and around Ottawa. The department’s emeritus professor Allan Donaldson has been active in geoscience outreach for a long time and started Friends of Canadian Geoheritage.
The Ottawa Riverkeeper website pays attention to Geoheritage
The Ontario highlands website has reams of Geoheritage activities, one of which is the iconic Metcalfe geoheritage park
Science North’s Dynamic Earth Centre, home of the iconic ‘Big Nickel’ in Sudbury is an amazing place to explore and learn about the Sudbury area geology and mining.
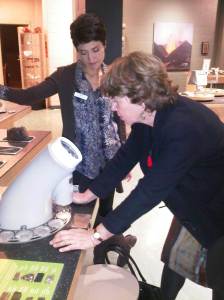
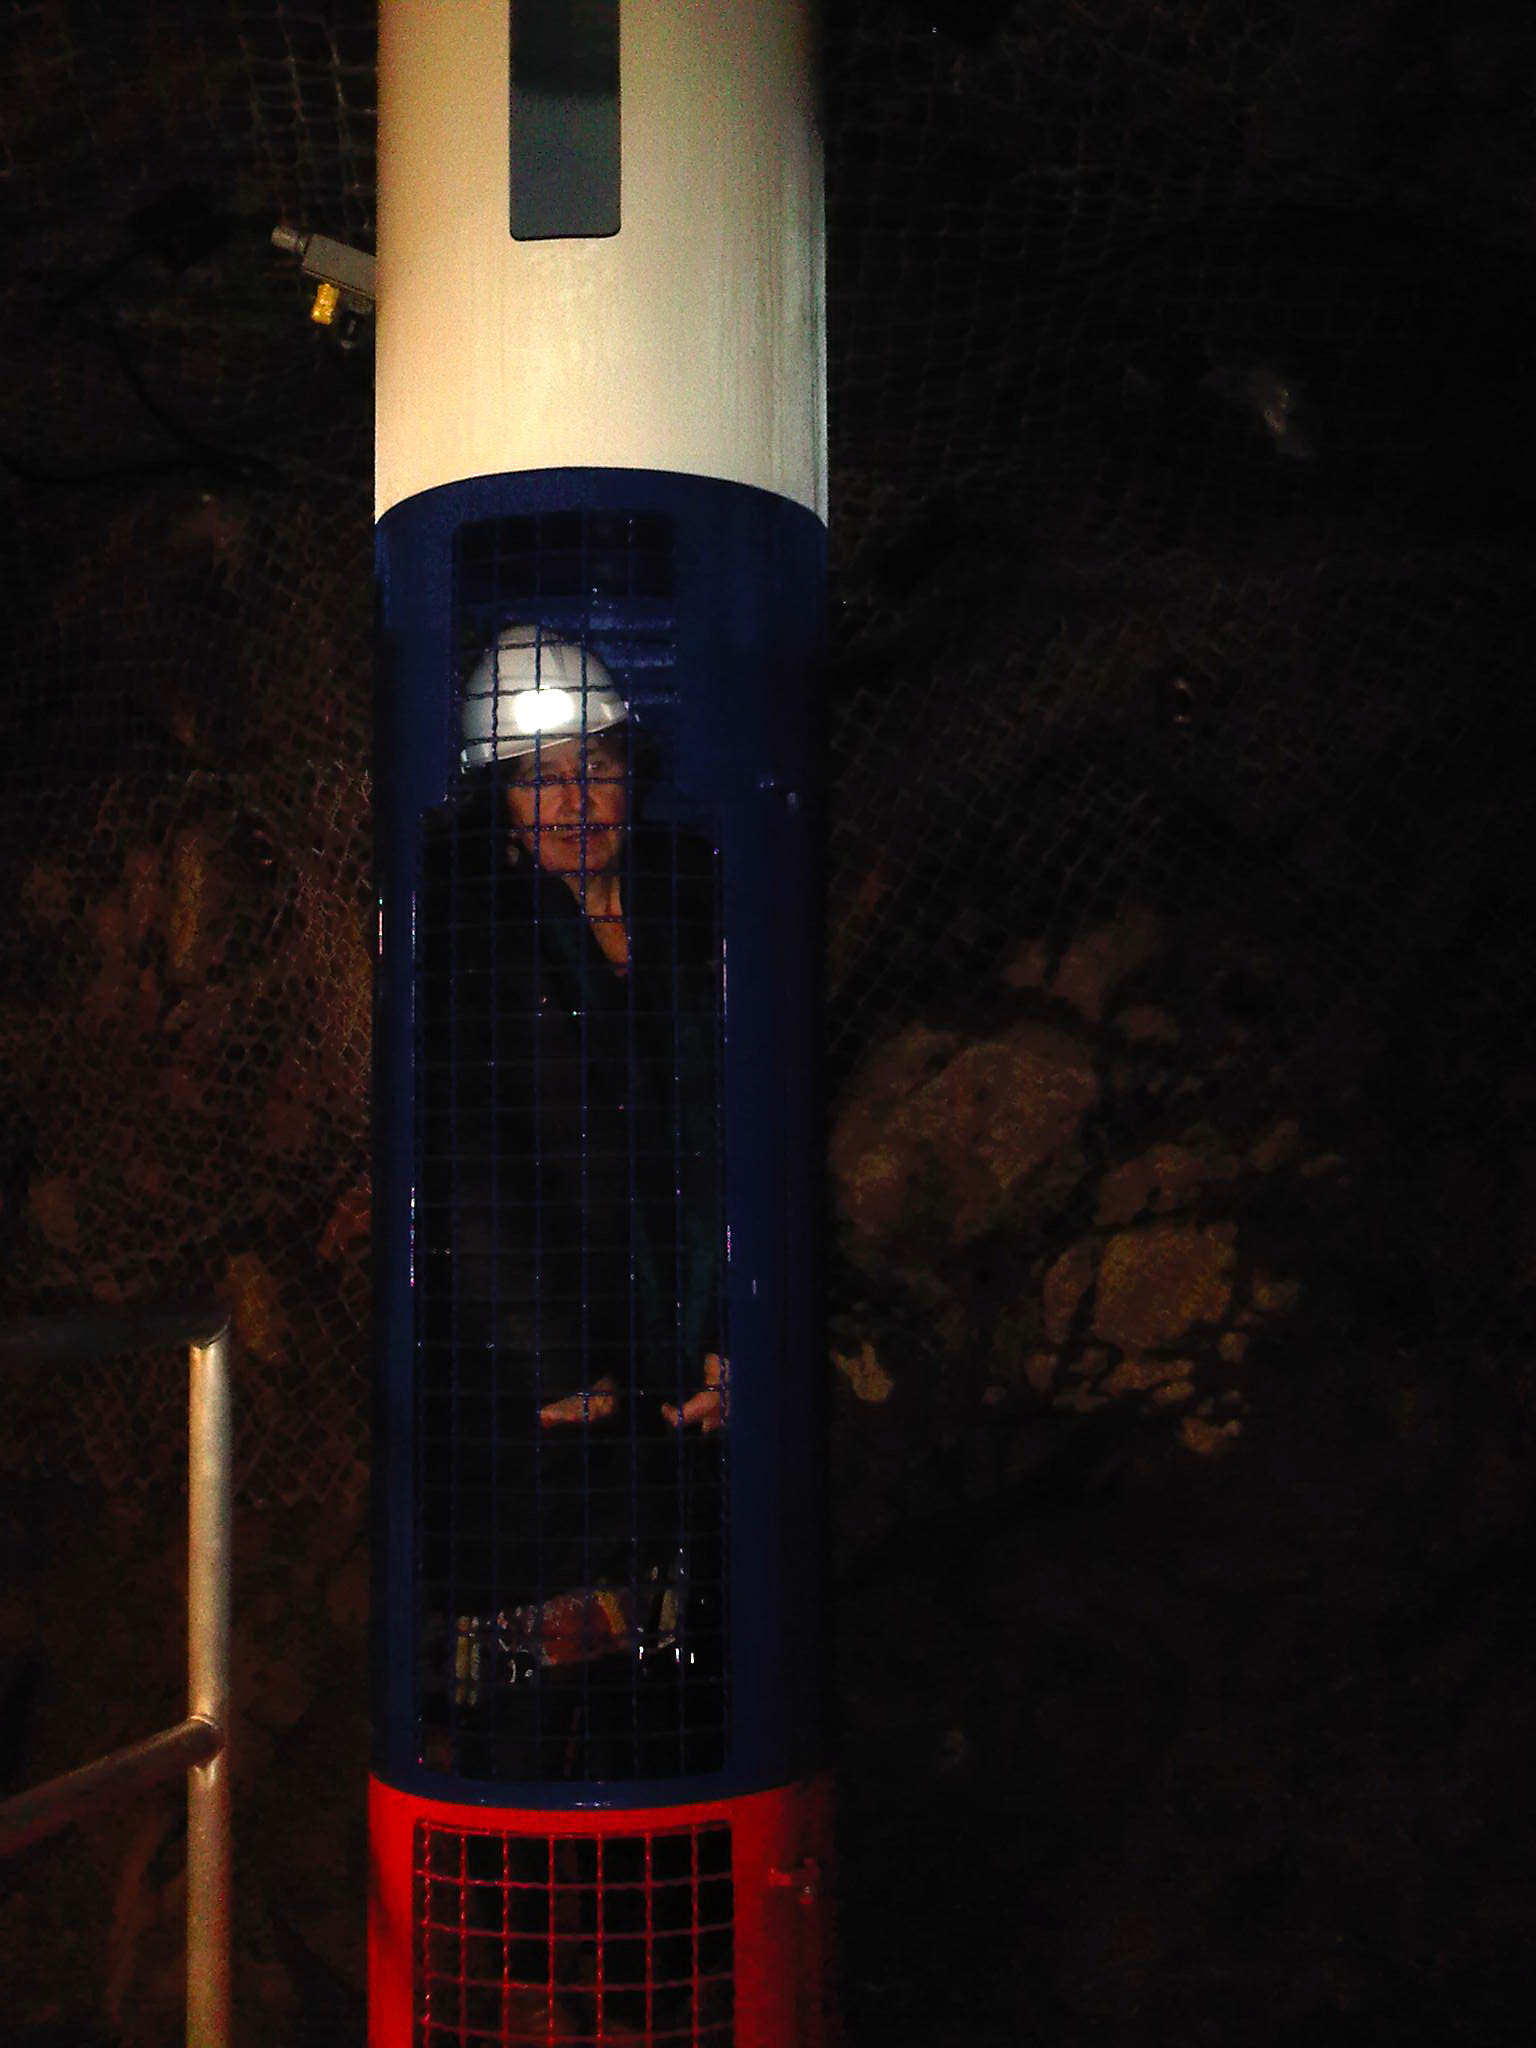 Left: Examining mineral samples under the microscope with Dynamic Earth director Mia Boiridy (photo Andy Fyon). Right: Inside the Phoenix capsule in Dynamic Earth’s own mine! This is the capsule that was used to rescue the 34 miners in Chile in 2010
Book: “Ontario Rocks” is a well-researched treaty on three billion years of geologic history of Ontario, written for the general public.
Nova Scotia: The Department of Natural Resources (home of the ‘mineral resources division’ = geological survey) is working on a Nova Scotia Geoheritage list – work in progress. The world famous light house at Peggy’s Cove is built on a unique granite outcrop and there are interpretation panels there. You can order the brochure here The Fundy Geological Museum in Parrsboro celebrates the local geology, but especially focuses on the oldest dinosaur fossil site nearby (Wasson’s Bluff), which also features in PBS’s ‘Your Inner Fish’, the documentary based on the same book by American Paleontologist Neil Shubin (see also my post on Nova Scotia’s Blue Beach).
The Maritimes: Published by the Atlantic Geoscience Society in 2001, “The Last Billion Years” is “a geologic history of the Maritime Provinces of Canada”. This book was a national non-fiction National best-seller that year and hasn’t been out of print since. It serves as a model for “Four Billion Years and Counting: a Canada’s geological heritage”, which came out in 2014 (I wrote a separate review of this book here).
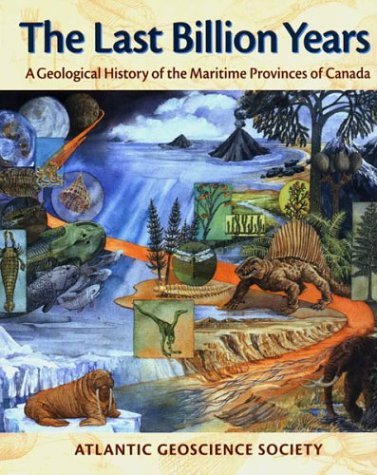 “The Last Billion Years” can be ordered from Nimbus
A totally unique and separate case:
The International Appalachian Trail celebrates geoheritage along the entire length of the Appalachian mountain belt – yes, all the way into Europe!
Posted in General geoscience, Geoheritage
Tagged Canada, earth science, geoheritage, geology, geoscience, geosites, geotourism
1 Comment
Canadian Earth Science for @PMHarper – 5: refining seismic risk assessment in Canada
The preamble to this series of reviews is here. All reviews can be found under the category “Canadian Earth Science for @PMHarper”
Atkinson, G.M. and K. Goda, 2011, Effects of Seismicity Models and New Ground-Motion Prediction Equations on Seismic Hazard Assessment for Four Canadian Cities. Bulletin Seismological Society of America, v. 101, no. 1, p. 176-189.
If only we could predict earthquakes as well as we can predict the weather for the rest of the week. But we can’t. That is, we know where earthquakes can strike but we don’t know when they will happen. In other words, we can predict them in space, but not in time.
Lots of research goes into attempting to make better earthquake prediction and this is of course necessary because the casualties are enormous: about 800,000 people died in earthquakes worldwide between 2000 and 2012. Many earthquake casualties occur because people are crushed in collapsing buildings and this happens especially in countries that don’t have the right building codes or where building codes were ignored. The latter usually happens due to poverty, lack of good governance and/or corruption (see my older post here).
Two regions in Canada are susceptible to earthquakes. In the west is Coastal British Columbia, which is situated on the large and active Cascadia fault (a good popular book about this feature and its associated risk is ‘Cascadia’s fault‘ by Jerry Thompson).
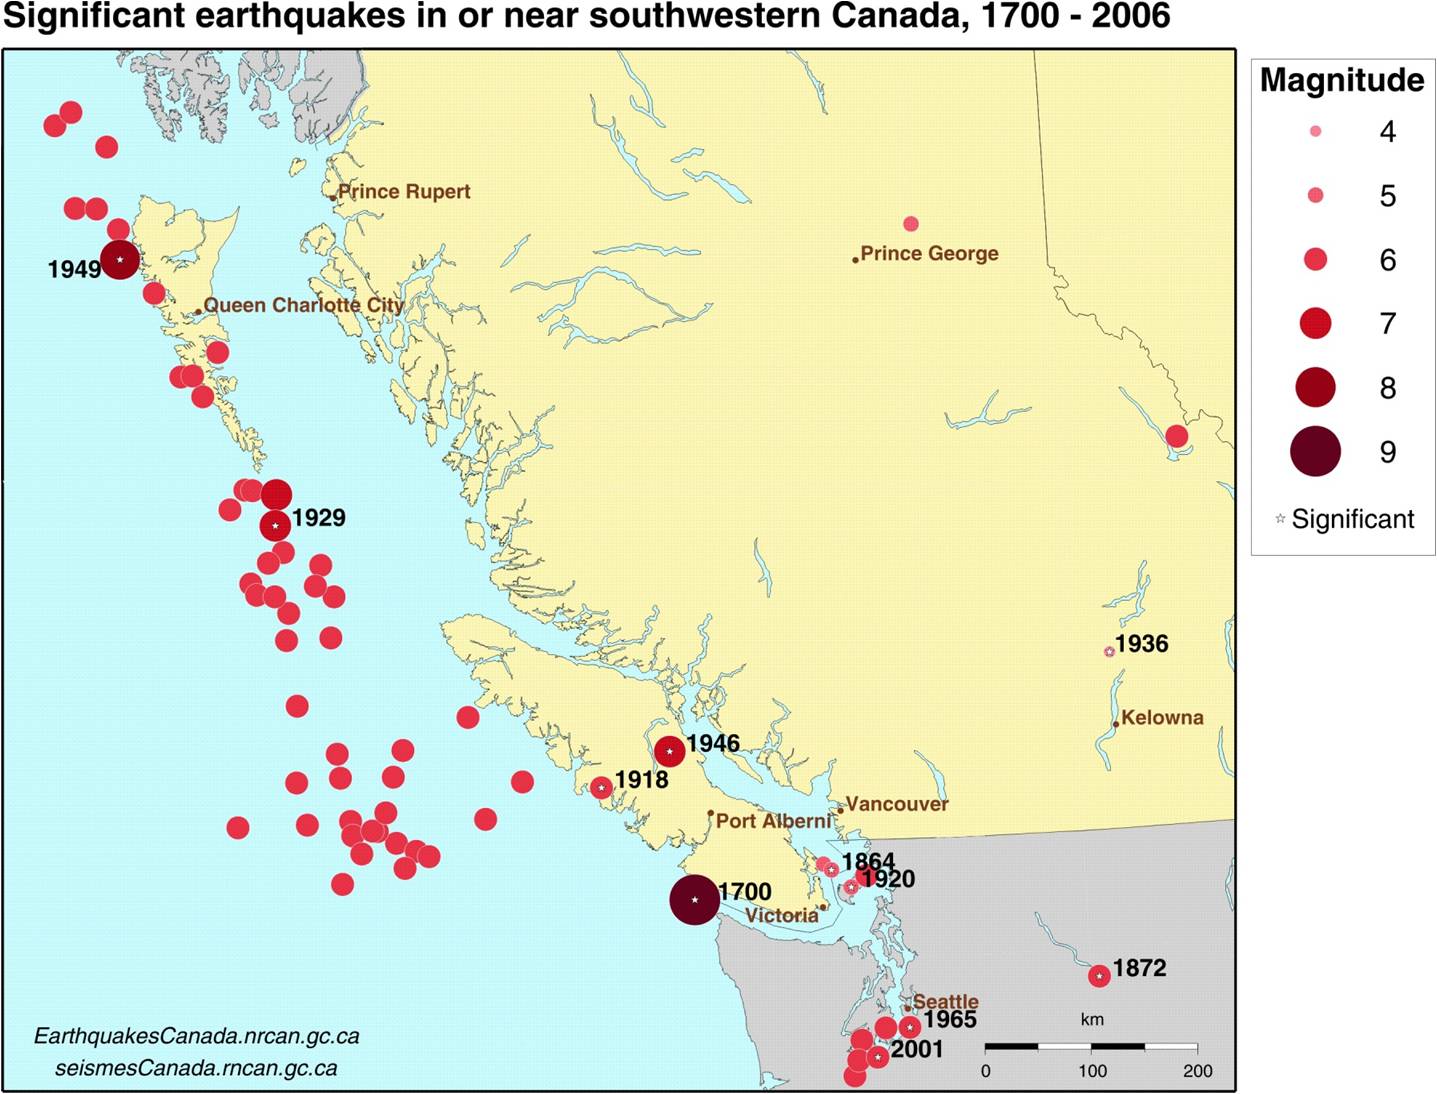
Figure 1. From Lamontagne et al., 2008
Eastern Canada does experience earthquakes too, although it will never experience the large earthquakes that are expected for western Canada because it’s geologically very different.
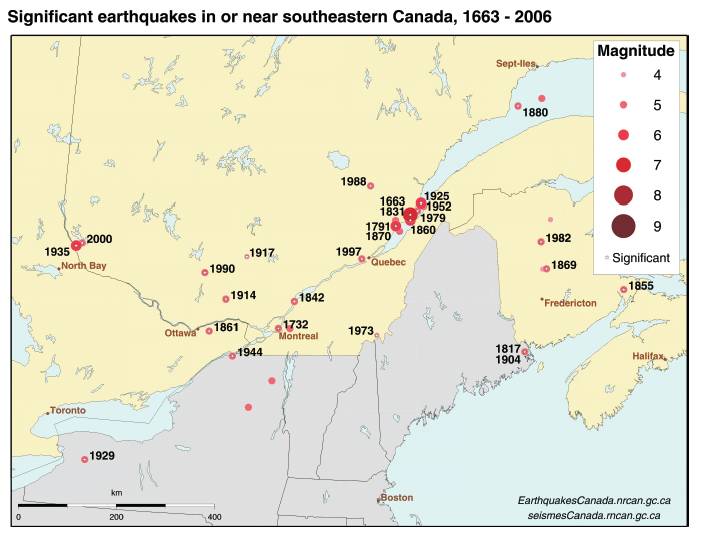
Figure 2. From Lamontagne et al., 2008
These figures show clearly that no truly large earthquake has ever struck eastern Canada, and we understand geology enough to be sure that that will never happen. However, smaller earthquakes can create all kinds of havoc and damage. As recently as 2010, an earthquake with moment magnitude 5.0 struck near Buckingham (QC) and was felt widely, also in Ottawa.
So earthquake-prone regions require the design and legalisation of building codes But how to quantify this kind of risk? And especially – how to quantify risk for something that happens rarely, such as a – mild – earthquake?
This is the focus of the article by Atkinson and Goda.
The paper is a contribution towards refining the risk of seismic hazard in coastal British Columbia (particularly Vancouver) and eastern Canada (particularly Ottawa, Montreal and Quebec City). The article does not aim to predict earthquakes in time.
The authors ask a question that can be phrased more or less as follows: “given that earthquakes of certain magnitudes occur in these regions, how large is the risk of damaging ground motion (and what implications does that have for building codes)?” To make that question a little easier to understand, you can think of the following question as an analogue: “given that about 2,000 people die in traffic accidents annually in Canada, how large is the risk for a Canadian to die in traffic?” If you wanted to answer that question, you would start collecting data over many years. You wouldn’t only count fatalities, but also age, gender, home province, type of transportation, etc. and then do the math (Statistics Canada has done that).
It’s more complicated to estimate seismic risk, but there are methods. These methods are based on an in-depth knowledge of the geology of a certain area (which tells us where the zones of weakness in the earth’s crust are). The models also require systematic information on every earthquake that strikes: its depth, its magnitude, over how large an area it was felt, etc. This information is collected constantly. The longer we collect this information, the more precise the models.
Geophysicists have developed models that enable predictions of ground motion on the basis of such data collection. Such models characterize the expected ground motion for a given risk (=probability). They are called “Seismic Hazard Models”
The standard Seismic Hazard Model for Canada was developed by the Geological Survey of Canada about 20 years ago. This model is the basis for our national building code. Of course, a lot more data have become available in 20 years and – just as important – insights and computer power have improved tremendously. So it’s appropriate to revisit and, if necessary, revise, improve and refine the model.
For example, a better model can improve risk estimates for soil liquefaction, a nasty ‘byproduct’ of some earthquakes: the 1988 magnitude 6 Saguenay earthquake (shown on figure 2) caused liquefaction at 25 km from the epicenter. A good 2011 CBC report discusses the risk of earthquake-induced liquefaction for greater Ottawa.
The biggest earthquake that occurred in Southeastern Canada was the 1663 Charlevoix earthquake (magnitude 7). The authors estimate that this was really a ‘clustered event’, meaning that it consisted of a series of quakes over a period of several hundred years, separated by quiet periods that may last thousands of years. This pattern is related to the geologic make-up of the region, mostly a very old fault that dates back ca. 400 million years. Such seemingly erratic activity can only be properly analyzed and modeled using advanced statistical methods.
After applying their improved methodology and incorporating new data, the authors show that the refined model results in different risk predictions for the four cities. Their model deals better with a number of uncertainties: certain risk windows become narrower. It looks like the seismic hazard for these regions is lower than the original 1995 model predicted. This would be good news (if the model is reconfirmed after additional testing) because it would save money on building codes.
There: expensive data collection and research leads – after decades of work – to improved and even cheaper building codes. Without decades of data collection, such a conclusion would not have been possible.
===
Dr. Gail Atkinson is a seismologist. She is Canada Research Chair in earthquake hazards and ground motion at the University of Western Ontario. A recent article in Time Magazine on concerns about hydraulic fracturing and earthquakes in Ohio quoted Dr. Atkinson. Many areas where hydraulic fracturing takes place do not have proper regulations for this industry in place (industry is always ahead of the law). Dr. Atkinson said: “There’s a very large gap on policy here. We need extensive databases on the wells that induce seismicity and the ones that don’t. I am confident that it is only a matter of time before we figure out how to exercise these technologies in a way that avoids significant quakes.” In other words: correlation doesn’t necessarily mean causality: not every observed earthquake in Ohio has to be caused by hydraulic fracturing and you need a lot of detailed data to do a proper analysis, after which it is possible to write proper regulations.
Reference
Lamontagne, M., S. Halchuk, J. F. Cassidy, and G. C. Rogers, 2008, Significant Canadian Earthquakes of the Period 1600–2006, Seismological Research Letters Volume. 79, No. 2, p. 211-223. This article is free to download.
A Tidal power lagoon in Nova Scotia’s Scott’s Bay?
Nova Scotia is where I live – a 700-odd km long NE-SW peninsula that more or less parallels the edge of the continent. What (almost) separates us from that continent is the Bay of Fundy, the Canadian extent of the Gulf of Maine. The ca. 300 km long Bay of Fundy has the world’s highest known tides, rising as much as 16m in upper Cobequid Bay.
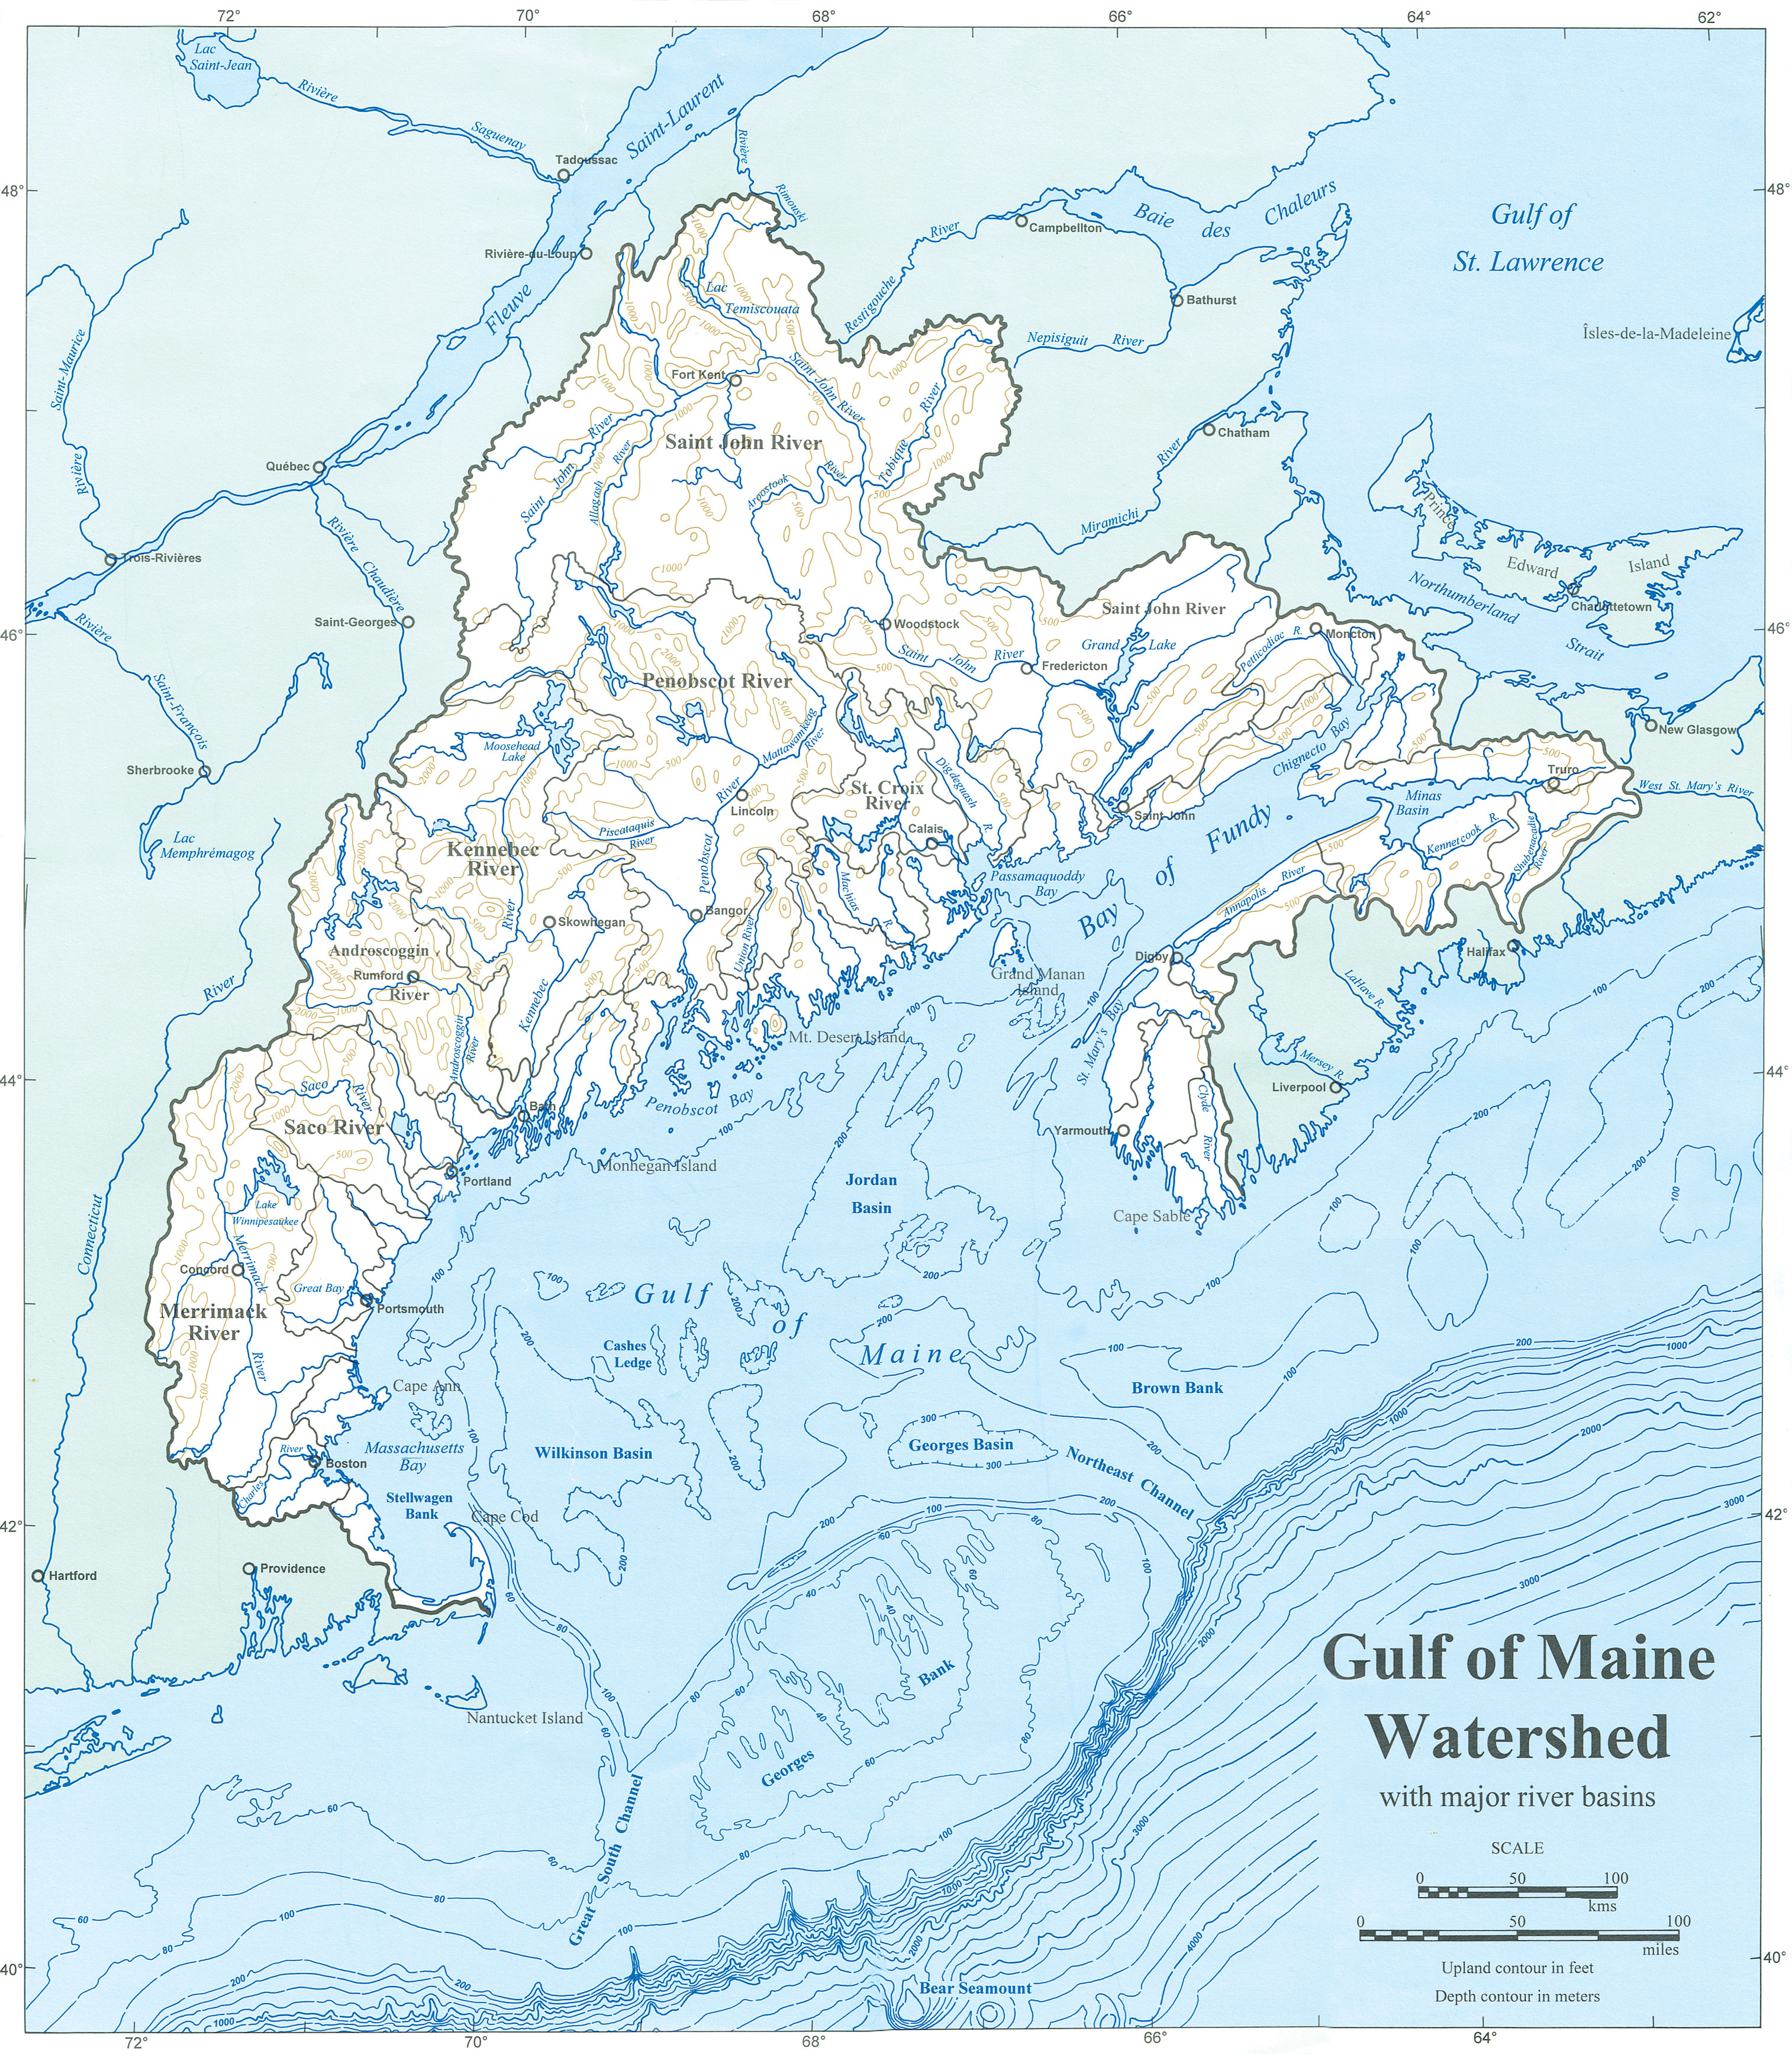

Figure 1. Left: Gulf of Maine and Bay of Fundy watershed map. Right: Bay of Fundy with tide ranges. In red the different localities discussed in this post.
Extracting energy from the Fundy tides is an old dream that was first articulated about 100 years ago.
A tidal power station was built at Annapolis Royal in the early 1970s and operated until 2020. It was the only barrage-type tidal power station in North America and generated about 20 Mw/day (the world’s oldest barrage-type tidal power station exists at La Rance in Brittany, France and generates about 240 Mw/day). A more recent (1994) barrage-type tidal power station is Sihwa Lake in South Korea, which generates about 254 Mw/day on the incoming tide.
A barrage-type system typically generates power on the basis of gravity, much as in a classic hydro-electric dam. Barrage-type tidal power stations thus require the construction of a solid dam, undoing the estuary. In the early decades after WWII nobody thought twice about undoing estuaries and damming rivers and in the process we lost thousands of free-flowing rivers and estuaries with catastrophic results for global ecosystems. I’m going to assume that my readers are familiar with the controversies.
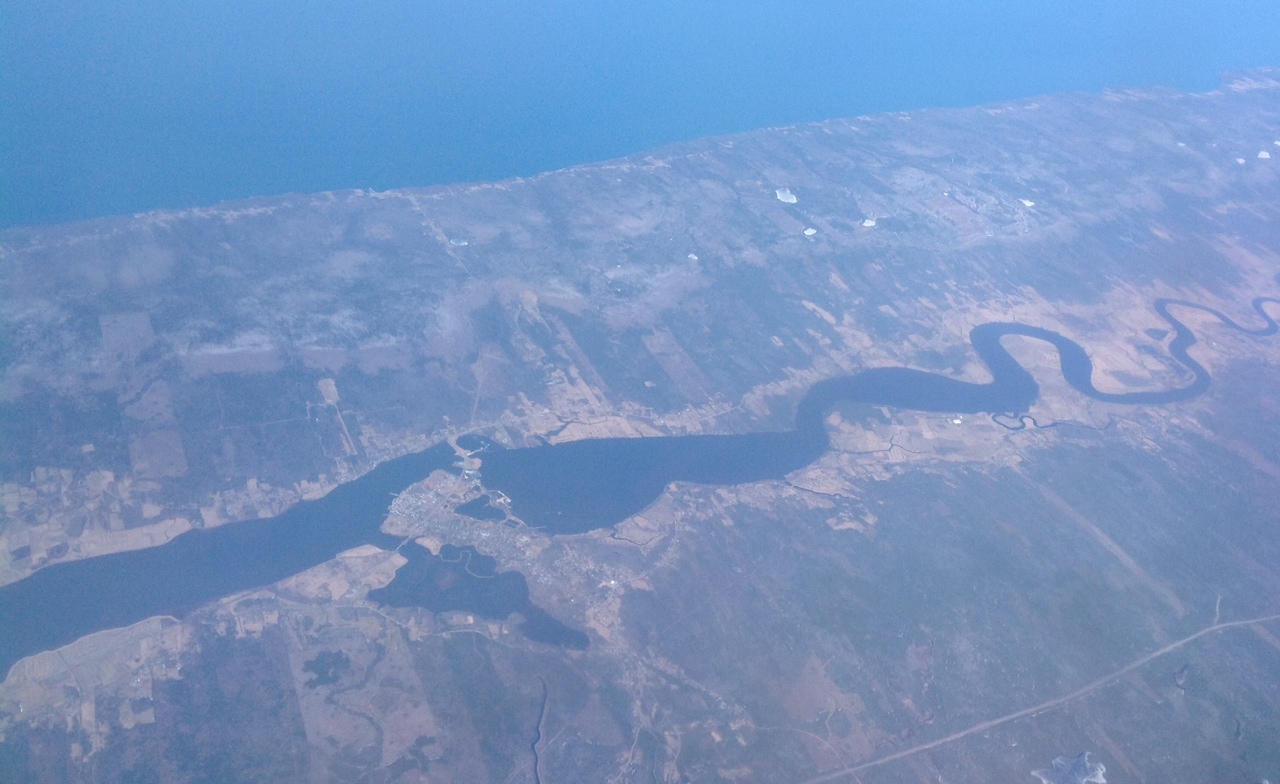
Figure 2. The Annapolis River at Annapolis Royal (NS). The Tidal power station sits in the middle of the dam that crosses the river. View to the NW. The open estuary is to the lower left. Photo E. Kosters
The Annapolis River tidal power station doesn’t contribute much to our daily energy needs, but it’s an interesting showcase. Even though there was much less public debate about damming rivers and estuaries in the early ’70s than there is now, the debate about the negative impacts of the Annapolis River tidal power station on the regional fish stocks is ongoing.
In the late 1970s, Nova Scotia considered constructing a tidal power barrage-type dam in Cobequid Bay (figure 1). As one local friend tells me “the dump trucks were ready to start piling rip-rap in the bay when word came that the plan was off”. The reason for canceling the plan was that the oceanographers at Bedford Institute of Oceanography had calculated that a dam in Cobequid Bay (where the tide range averages 14m) would reflect the tidal wave in such a way that the average tide range in Boston would rise by at least 30 cm. The amphidromal point (node) of the Bay of Fundy’s tidal wave sits more or less on the George’s bank (in the Gulf of Maine) and the Bay of Fundy is getting close to resonating with the semi-diurnal tidal wave of the Atlantic ocean so the crest of the wave is more or less at the head of Cobequid Bay (at a town called Truro). Canada didn’t want to risk angering its neighbour and having to pay for the damages. The dam was off.
Roaming around this area now (I didn’t live here at the time of this barrage proposal), I find it hard to believe that anyone would have agreed to simply clip out part of this stunning landscape.
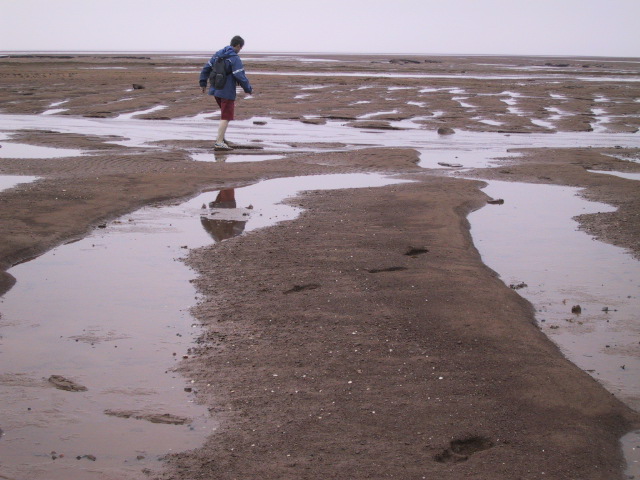
Figure 3. Upper Cobequid Bay – these tidal flats would have disappeared behind the tidal power dam that was almost built in the late 1970s. Photo E. Kosters
The interest in tidal power generation subsided until the late 90’s when new technologies and concern about climate change brought the subject back on the global agenda. By this time, we knew that damming estuaries was damning to the environment and thus to ourselves. So this time the focus is on ‘in-stream tidal power’. No damming required. Estuaries stay open to the migration of fish and water and nutrients. A large variety of turbines is designed and tried out all over the world. The engineers are having a ball. Examples are here and here and here and here (random examples).
One of the world’s most powerful currents runs in Minas Passage (Figure 1 above) – current velocities of more than 10 knots (5 m/sec) are not uncommon.
Until a few years ago, Nova Scotia generated close to 60% of its electricity by burning coal. The provincial government decided to aggressively reduce that proportion and invest in green energy schemes. Within a few years, the proportion of coal-powered electricity dropped to just over 40%. The government invested heavily in attracting tidal power companies. There is essentially an open bid system. Also, after much research, Nova Scotia ‘opened’ a government-supported berth in Minas Passage (Figure 1) in 2009. The research that led into the definition of this berth was thorough: multibeam bathymetric surveys, sediment dynamics studies and all kinds of biological research were carried out or summarized from existing literature. The first pilot turbine was placed on the berth in the Fall of 2009.
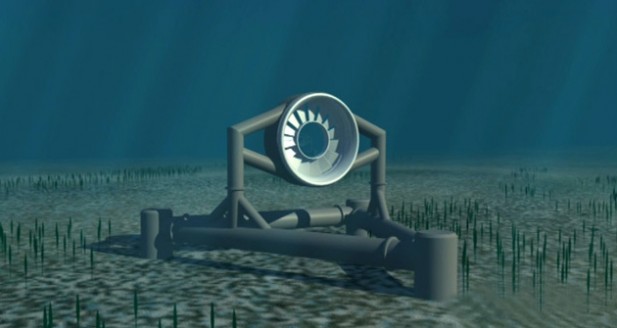
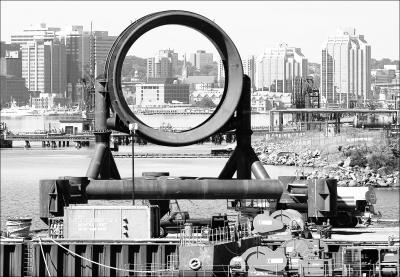
Figure 4. Left: artist impression of the turbine that was placed in Minas Passage in the Fall of 2009. Right: the Minas Passage turbine after it was retrieved in the Fall of 2010. The turbine had lost all its blades within two weeks of having been placed.
Not a success right away: the turbine – carefully selected from a number of proposed models, had lost all its blades within 2 weeks of having been placed. To this day, nobody understands how, except that – clearly – the currents are more violent and destructive than anyone had anticipated. A learning experience! Things have slowed down somewhat since then, but nobody is giving up hope. The NS Government, together with a variety of stakeholders has created Force. The FORCE interpretation centre sits where the specially made electricity cable from the Black Rock berth area comes ashore and is open to the public. The next pilot turbine is supposed to be placed later this year. We are still in the experimental stage. We keep our hopes up. A smaller-scale experiment is running further south along the Fundy shore.
There is an in-between type of tidal power generation, called ‘tidal lagoon’. Essentially this is a dam, built in an estuary, sometimes connected to the shores, but sometimes isolated by itself, with multiple turbines in the dam. As the tide rises, the lagoon fills with water through the turbines (in some types the turbines generate power both on the incoming and on the outgoing tide) and later empties again.
No tidal lagoon has been built ever. Anywhere. There is a proposal for a tidal lagoon off Swansea (fabulous website) in the Bristol channel where the tides rise as much as 9 m. It’s under investigation.
Recently, Halcyon Tidal power submitted a proposal for an enormous lagoon, to be constructed from shore to shore at Scott’s Bay, NS.
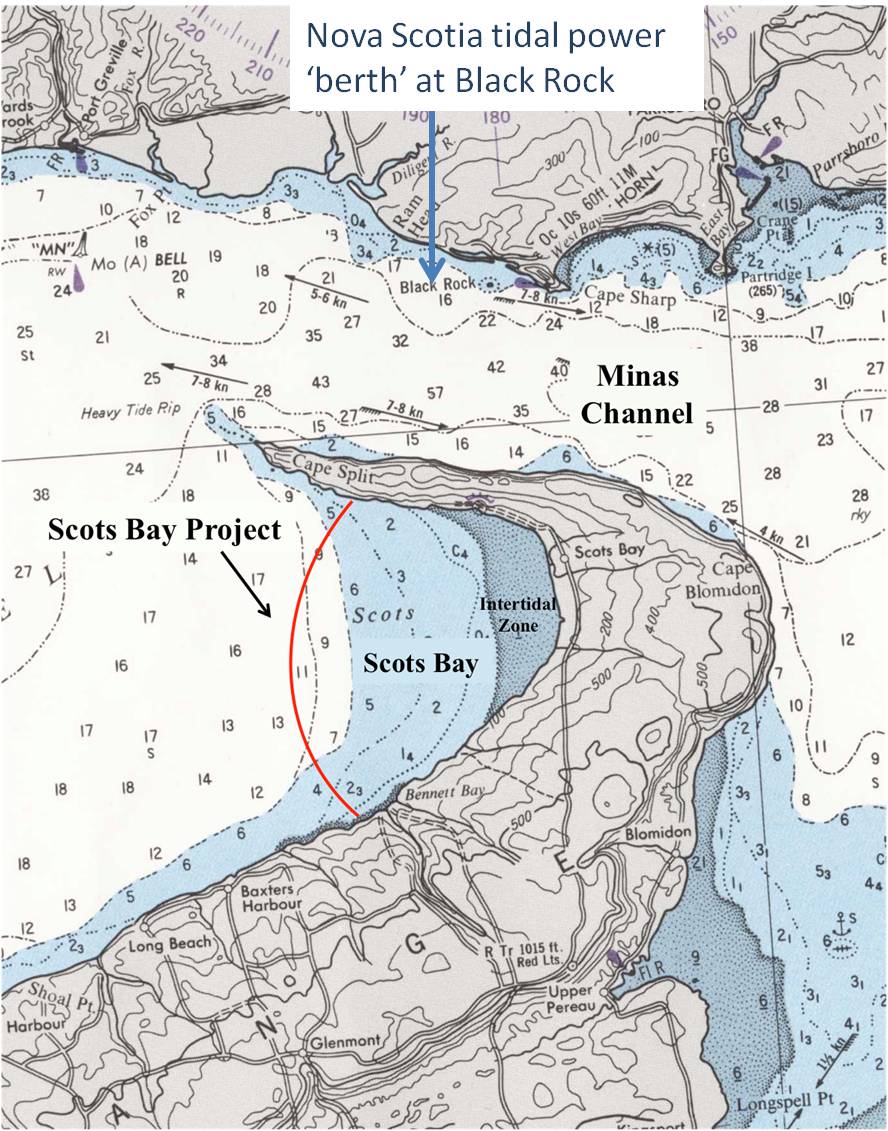
Figure 5. Halcyon’s proposed lagoon. The dam will be nearly 9 km long and will contain dozens of turbines. Ca. 250 people live in Scott’s Bay. Note location of the official berth at Black Rock on the north shore of Minas Channel (a.k.a. Minas Passage).
Halcyon is a two-person American company, consisting of an engineer (Dr. Atiya) and a venture capitalist (Craig Verrill). Dr. Atiya holds the patent to a special turbine and he is anxious to deploy it. Halcyon hosted a community meeting for the people of Scott’s Bay to present and discuss their plan. The meeting is reported here. It was a shameful event for Halcyon: the two gentlemen came with 8 or 10 illegible slides, appeared ignorant on crucial issues of the hostile physical environment and infrastructural requirements. They were also unaware of essential research of the Geological Survey of Canada, were unaware of the electricity need of Nova Scotia (their lagoon would generate far more power than we can use and we have no infrastructure to ‘get rid of it’) and generally displayed a contemptuous and patronizing attitude towards their audience.
Despite their inability to answer simple questions, they had no problem making strong statements. Among others, they stated emphatically that the tidal regime in Scott’s Bay would not change at all (!) due to the construction of this dam; the tidal cycle would only be delayed by 1 hour (exactly….) compared to that of the open bay. Especially this last statement (also present on their website) really puzzled me. Because you need very sophisticated models to make such a statement and they didn’t even know the first thing about some of the basic physical constraints – how could they make this statement?
Several years ago, a different company proposed to build a tidal lagoon in Minas Basin, more or less on the location where the barrage was supposed to be connected to Minas Basin’s northern shore in the 1970s. At the request of the NS Government, scientists of the National Research Council set out to model the potential effects of such lagoons. The modelers recently published their article (Cornett et al., 2013 – see below for full reference). These lagoons would require a dam of about the same length as the one proposed for Scott’s Bay, i.e. they may be thought of as somewhat comparable.
If you have the least bit of interest in tidal power generation, I encourage you to read this article, it’s a beauty. I enclose only one illustration here
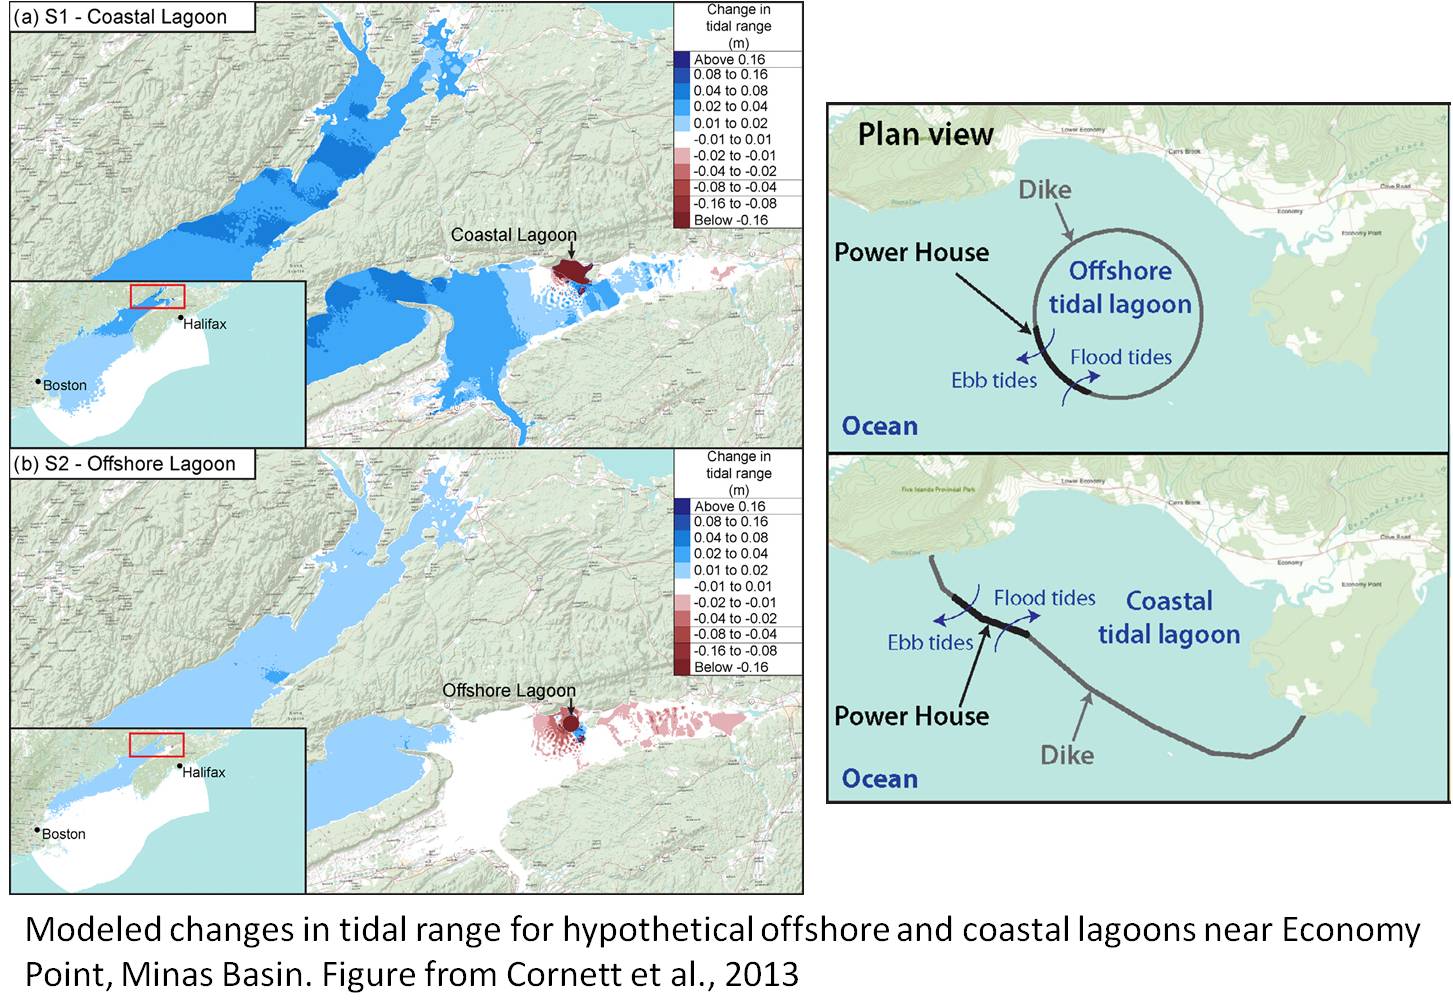
Figure 6 – Cornett et al., 2013
Some of their conclusions (exact quotes):
- “a small change in tide range is predicted throughout the entire Gulf of Maine, even for the smallest development scenario”
- “the magnitude of the changes in tidal hydrodynamics increase with the scale of lagoon development, with larger lagoons and multiple lagoons inducing greater hydrodynamic changes”
- “a single 26.7 km2 coastal lagoon operating in Minas Basin with an RMS power output of 264MW will cause the tide range in Boston to increase by 1.4 cm, while three coastal lagoongs operating in Minas Basin with a combined area of 94.8 km2 and a combined RMS power output of 988MW will lead to a 7.2 cm increase in the Boston tides”
- “Interestingly, the tide range at Boston is found to be more sensitive to lagoon development in Chignecto Bay than in Minas Basin, whereas the tide range at Bar Harbor, is more sensitive to lagoon development in Minas Basin. Furthermore, at Saint John the tide range is found to be sensitive to lagoon development in Minas Basin, but insensitive to lagoon development in Chignecto Bay. In summary, lagoon development in Chignecto Bay will increase the tide range at Boston and Bar Harbor, but not at Saint John, whereas lagoon development in Minas Basin will increase the tide range at all three cities”.
- “While the scale of these changes represent a small fraction of the tide range at each community, their potential impact on communities and ecosystems warrants careful consideration and further investigation. Without further study it is difficult to comment on whether the potential benefits of tidal power lagoons might outweigh the drawbacks associated with these changes in tidal hydrodynamics”
Nice – when all you need to do is quote. Nothing more needs to be stated, right?
Altogether aside from these geotechnical complications is the issue of Scott’s Bay itself. Should we even consider damming off a part of this breathtakingly beautiful bay? Few people live in Nova Scotia: we are less than 1 million (and greying). One third of us live in greater Halifax, the rest live spread out along our 4000+ km coastline. The climate isn’t great, we are far from markets, our soils are hostile, our seas and bays are overfished. But we have stunning natural beauty and the Bay of Fundy rightfully competed with 20 other locations for ‘one of the seven natural wonders of the world’.
We must reduce our use of fossil fuels and we must explore and deploy green energy, including tidal (and wave!) energy. But we can’t afford to move forward in the same manner that we’ve done for hundreds of years, namely by rash development under the justification of ‘green energy’. We must research and explore tidal power, but I think only true in-stream tidal power – and we don’t need bullies.
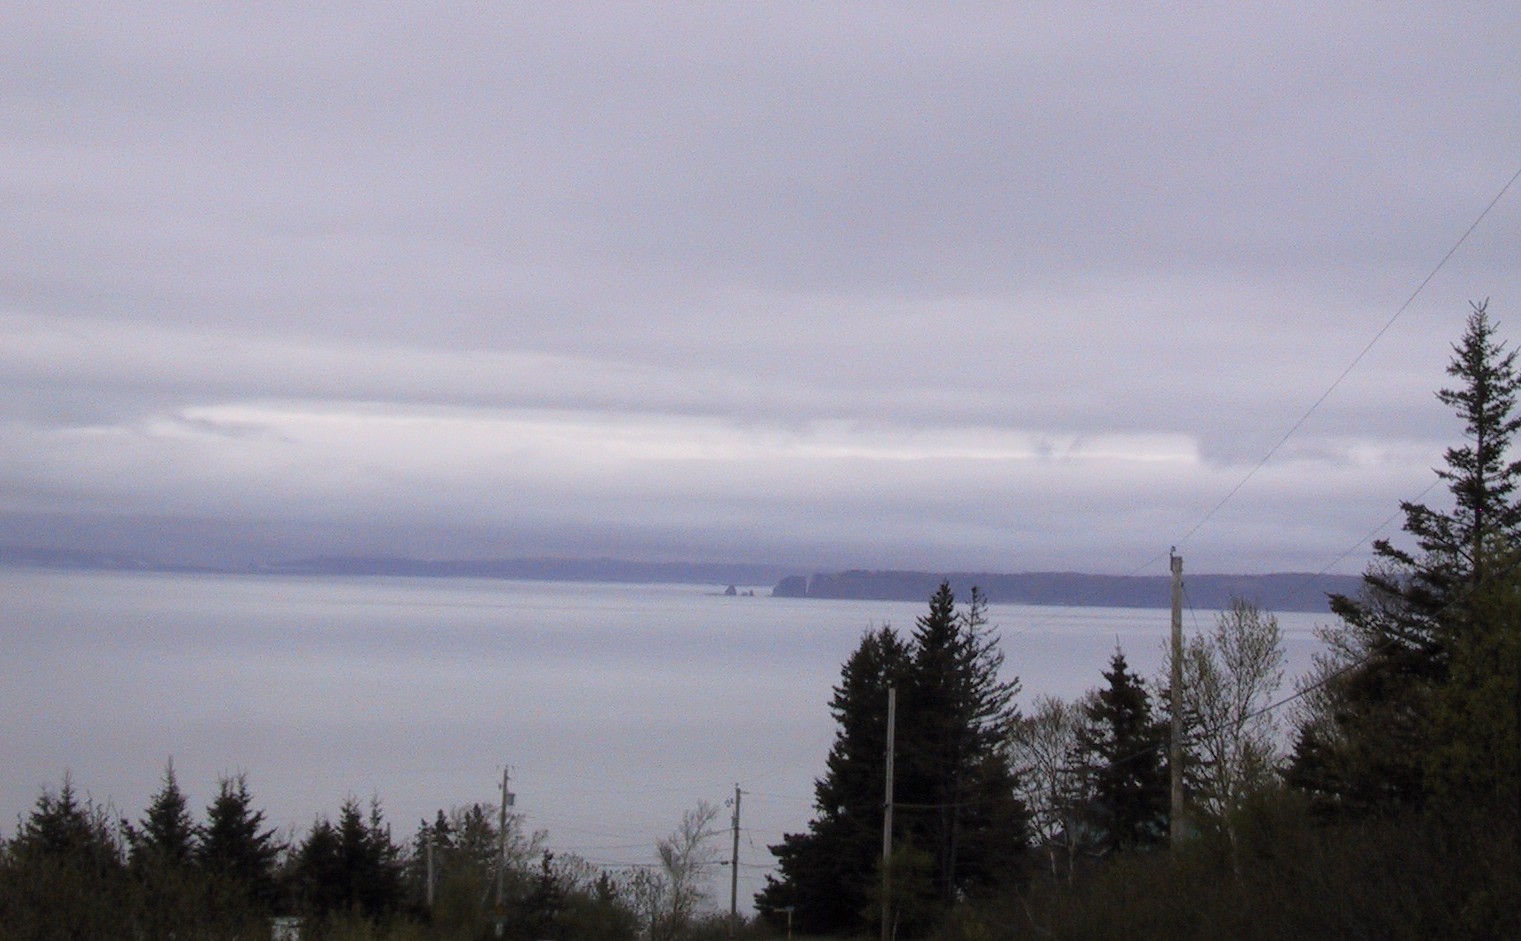
Figure 7. View across Scott’s Bay from above Baxter Harbour. The proposed tidal lagoon dam would cross from here to iconic Cape Split across. Photo E. Kosters
Useful websites
Nova Scotia Department of Energy
Reference
Cornett, A., J. Cousineau and I. Nistor, 2013, Assessment of hydrodynamic impacts from tidal power lagoons in the Bay of Fundy. International Journal of Marine Energy, v. 1 p. 33-54.
Nova Scotia Government tidal energy video on YouTube
Posted in Energy, General geoscience, Minas Basin, Bay of Fundy, Nova Scotia
Tagged Atlantic, Canada, Climate Change, earth science, energy, environment, geology, geoscience, Nova Scotia, oceanography, Science, Sea Level, tides
1 Comment
Canadian Earth Science for @PMHarper 4 – Ice ages and Klondike gold
The pre-amble to this series of reviews is here
Froese, E.G., Zazula, G.D., Westgate, J.A., Preece, S.J., Sanborn, P.T., Reyes, A.V., Pearce, N.J.G., 2009, The Klondike goldfields and Pleistocene environments of Beringia. GSA Today, v. 19, no. 8, p. 4-10.
We live in a time that is characterized by the coming and going of Ice Ages. Many people think of the Ice Ages as something of the past, but our current Holocene period (roughly the last 10,000 years) is just the latest warm interval in 2 million year period of glacials and interglacials (whether humanity is warming the planet to the extent that we won’t be able to return to an ice age at some point, is not the subject of this blog post).
For this post, I am only concerned with northern hemisphere ice ages. During such periods, Arctic ice caps swelled, crawled southward and at some point began to retreat again. When ice caps reached their southernmost extent, we talk about a ‘glacial maximum’. The most recent glacial maximum, called the ‘last glacial maximum’ (LGM), lasted roughly from about 26,000 to 20,000 years ago.
While ice caps can overrun all kinds of topography and generally cover a continental area indiscriminantly, it’s not unusual for certain pockets to remain free of ice, usually because it’s too dry, as in today’s Dry Valleys in Antarctica. During the LGM, and probably during earlier glacial maxima as well, parts of Yukon and Alaska were ice-free, as shown in these illustrations.
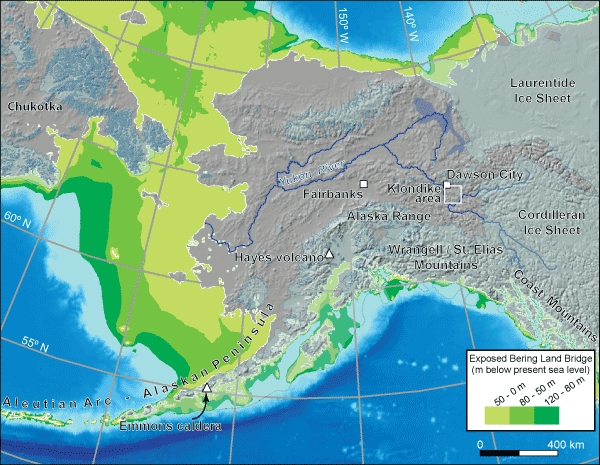
Alaska and Yukon during the Last Glacial Maximum (26,000-20,000 years ago). Global Sea Level stood ca. 120 m lower than today. The green colours show regions that are currently under water but were land during the LGM, thus forming a continuous land area between NW North America and NE Asia (the ‘Bering Land Bridge’). The pinkish area is now and was then land and it was largely unglaciated, except for local uplands. Figure 1 from the discussed paper. Original image from Ehlers and Gibbard, 2004.

The entire area is known as Beringia, a 3,000 km wide region. Figure from Yukon Gov’t website
This ice-free region was a freeway, an interstate, a favourite hiking trail for every living being that couldn’t fly or swim and had the urge to travel east to North America, or West to Siberia. Included in this crowd were the ancestors of indigenous Americans (they likely also paddled, but that’s a different story).
Beringia was likely also largely ice free during the waxing and waning of earlier continental ice sheets, maybe as far back as 2 million years ago. So each time the continental ice caps covered the region, this area remained ice-free, a perfectly delineated refuge for plant and animal species traveling, living and dying through the cold spell. And the absolute most special thing of all is that it is possible to acquire precise dates for when various ecosystems existed thanks to the presence of a number of active volcanoes in the Aleutians. Volcanoes blanket large areas with ash. The ash of each volcano has fairly unique composition so that we can distinguish between different ash layers. Also, volcanic ash contains unstable isotopes that enable dating them precisely using radiometric dating methods.
What does this have to do with gold mining?
Miners dig. They create holes in the ground, sometimes very large holes and in this way they expose underlying rock and/or sediment. Ever since the first Klondike Gold Rush in the late 1990’s, the area has been a treasure trove of Quaternary-age fossils, exposed by the work of gold miners, followed on their heels by paleontologists from all over the world. Much of the gold is sourced in a mountain called the King Solomon’s Dome, so many of the gold mines are located in the banks of creeks running off the dome where the gold that eroded off the mountain became part of the sediment deposited around it. The climate had a big control in how much sediment was produced from mountain erosion. During ice ages, the sediment became frozen solid and much of it remains frozen today, sometimes mixed in with wind-blown dust from those times and also mixed in with volcanic ash. This lovely mixture (gravel, ice, silt, and ash) is known as ‘muck’. This muck is “Beringia’s Ice Age Freezer”. To this day, the best muck sites are on north and east-facing slopes or in narrow valleys, i.e. areas that receive the least sun and are thus also covered by insulating soils and vegetation.
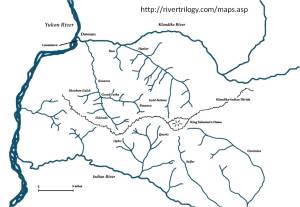
Yukon’s King Solomon’s Dome, showing radial drainage patterns. Many of the Klondike gold mines exist along these creeks and rivers.
Interestingly, these valley sides and bottoms were better drained during glacial times thanks to the presence of burrowing ground squirrels which no longer live there. They aerated the soil, so that it could support grasses and herbs, the favourite food for large herbivores such as mammoths, horses and bison (also found as stomach remains in these fossils). Today’s interglacial (warm period) vegetation would not support those grazers!
==
What a fascinating story, made possible by blending the knowledge and experience of so many different experts: a diversity of paleontologists, soil scientists, (paleo)-ecologists, geologists, miners and historians (and forgive me if I forget someone). This is one of those role-model-stories that goes to show that our different scientific fields are not isolated from each other, that innovation takes place by bringing gaps between well-established fields.
For knowledge to truly develop and progress, it must be able to both deepen and widen. Deepening through specialization (how do you tell one volcanic ash layer apart from another, for example) and widening through connecting specialized findings with each other (e.g. ground squirrel burrows and fossilized stomach content). Most of these knowledge cooperations aren’t planned at the onset, i.e. decades ago when earlier generation scientists established the original knowledge base in their field.
This kind of dynamic is always difficult to explain to the general public (including politicians). Many people continue to think that scientists just dally along, meandering happily along their hobby paths without feeling an ounce of accountability towards the tax payer (usually their sponsor). Such people would like to see more innovation, more direct results. Problem is, that’s very hard to enforce and efforts to control and direct have a serious risk of impoverishing of the knowledge base.
While this story may seem to be just another lovely hobby story (what is really the societal relevance of extinct mammoths, right?), this research does improve our understanding of the intricate smaller-scale details of climate change and that in turn may help improve predictions about what’s awaiting us in the near future.
In addition, this story forms part of the rich cultural heritage of Beringia-Klondike and it may some day become formally recognized internationally.
External links
The popular version of this journal article is a downloadable pdf on the website of the Government of Yukon
Yukon Beringia Intepretive Centre
US National Park Service Klondike Goldrush website
Wikipedia Klondike Gold Rush page
Travel Yukon page on Klondike Gold Rush
Canadian Encyclopedia entry on Klondike Gold Rush
A no-brainer for every earth scientist: time travel!
Because this is a WordPress blog, I receive the weekly WordPress writing challenges, which are all about encouraging and helping aspiring fiction writers, which I am not.
However, this week’s challenge is irresistible – Time Travel! This is the challenge (I took out references to other human beings): we’re giving you a free ticket to the period and place of your choice.. be an invisible observer or an active participant… let bygones be bygones and just travel in time to the future – don’t forget to come back to tell us how it was (http://dailypost.wordpress.com/2014/03/31/writing-challenge-time-machine/)
Every earth scientist badly desires to go back in time, sometimes to a time period that has been the subject of a research project, sometimes to a time period that just seems fascinating. If I could pick just one period and place, what would be my choice?
My choice is going to depend on the answers to a few other questions that the WordPress challengers didn’t formulate (they didn’t think of earth scientists, alas).
1. How long do I get to stay? Geologic processes take a long time and if I only get a human life span for this trip, then quite a few choices fall by the wayside. A lot of geologic events qualify as extremely boring from a human perspective because they last too long! For example, I would not choose to observe the complete eruption of the Deccan Traps, a 50,000 km2 basalt blob that forms the core of the Indian subcontinent, because that ‘event’ lasted from 68-60 million years ago. You can’t watch only 10-5 of that event (one human life span) to get what you want out of that observation. And while you may think that this was an excruciatingly slow eruption, it was quite sudden and short-lived from the perspective of earth itself. Some scientists think that it exponentially increased the amount of CO2 and GHG in the atmosphere so much that this became a crucial factor in ‘killing the dinosaurs’ (popular speak) at end of the Cretaceous. We have known the end of the Cretaceous as the end of the ‘age of reptiles’ for a long time. Their extinction vacated a niche that subsequently became occupied by a tiny mammal (a sort of vole) and this eventually paved the way for the big mammal take-over including ourselves. 
Field view of the Deccan Traps (Wikimedia)
 Location of the Deccan Traps (www.whoi.edu)
2. Do I get to be immune if I choose to visit to a catastrophic geologic event? The great classic being of course the asteroid impact that killed those dinosaurs around 65 million years ago. It would be something to behold, but unless I’d be given supernatural powers (or a very advanced planetary rover maybe?), I wouldn’t survive the observation. I’d love to watch that, though – but from where? I think I’d go sit on the edge of the Cretaceous Edwards Plateau in what is now Austin, TX because I’d like to see the tsunami. I worked in Austin for two years and used to hike the dry river beds north of the city and these amazing deposits on top of the Edwards limestone along the creeks. They looked like regular braided river deposits to me, but at the time the Chixchulub crater had not been located yet (the whole hypothesis of the end-of-Cretaceous asteroid was considered pure speculation by many), so we didn’t think of researching whether they would be something else. But now some of those gravels are considered Chixchulub-impact tsunami deposits (e.g. this article), although that’s still doubted by others. (e.g. here).
Location of Chixculub crater and sites of interpreted tsunami deposits around the Gulf of Mexico. My 1980’s hikes took place just south of the Brazos River site
Having considered all this, I have decided to stay low-risk, I’m going back about 3,500 years and I’m going to my own back yard: Nova Scotia’s Minas Basin, the northeastern extent of the Bay of Fundy.
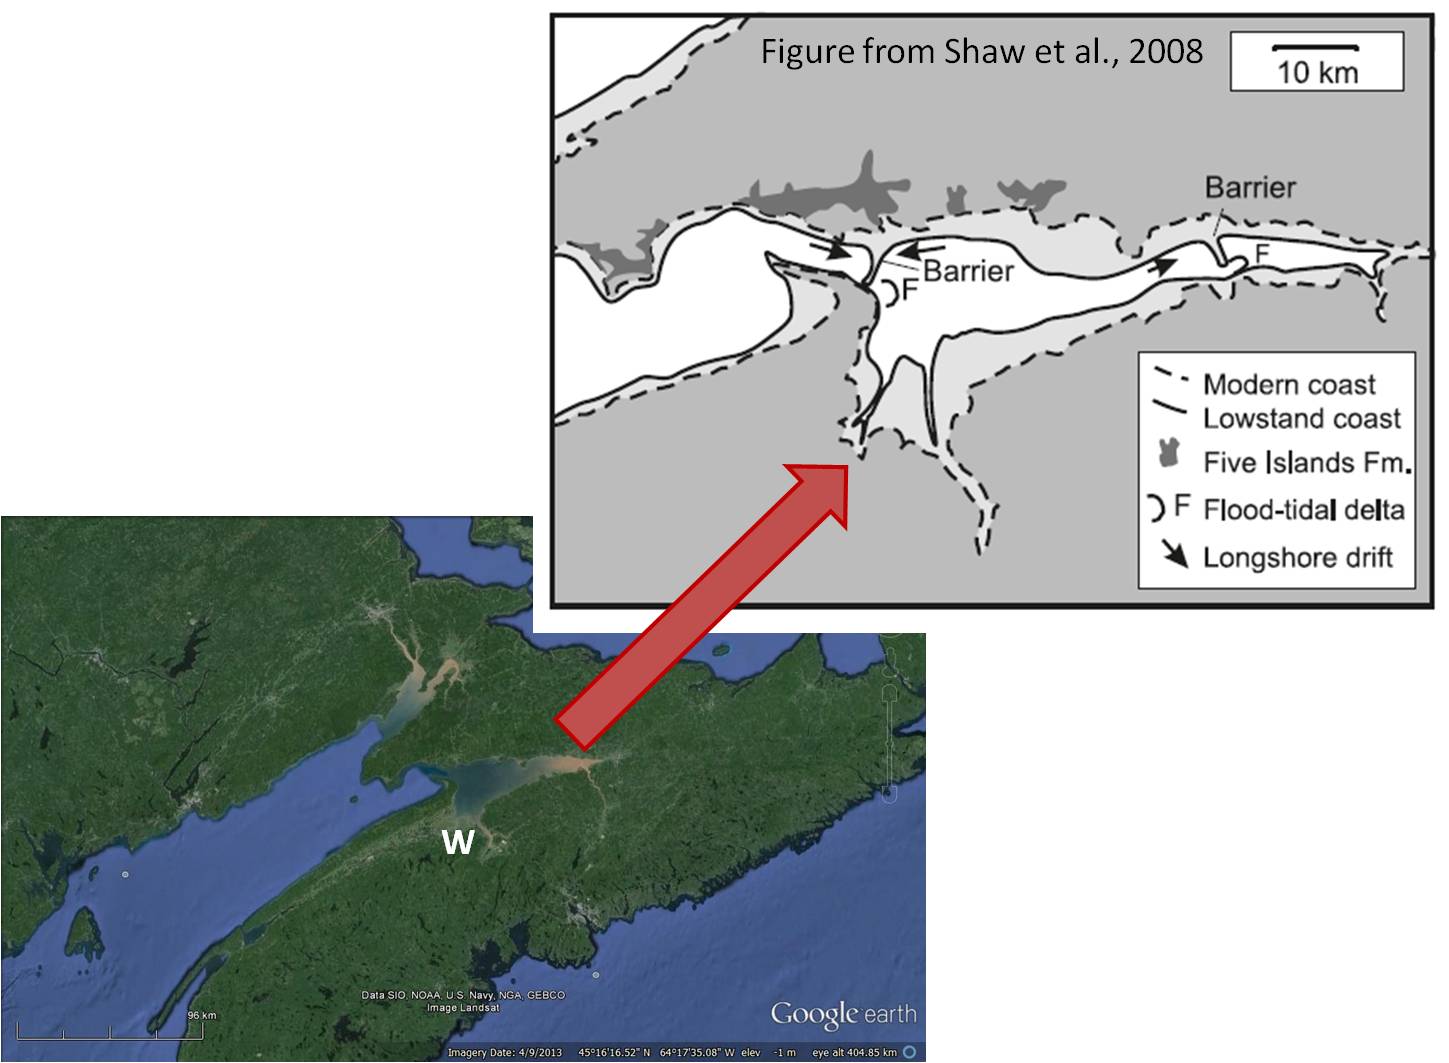
Location of the Bay of Fundy and (insert) hypothetical paleogeography of Minas Basin around 3,500 years ago. W=Wolfville (where I live).
As sea level rose during the rapid warming after the latest ice age, the continental shelf and what is now the Bay of Fundy became quickly inundated. The timing of that inundation has been well documented through countless carefully collected C-14 dates, but there was always an inconsistency between the dates obtained in the Bay of Fundy proper and those in Minas Basin, suggesting that Minas Basin flooded later and that the increase in tide range (Minas Basin has the highest recorded tides in the world) happened quite suddenly. around 3,500 years ago.
A few years ago, a Geological Survey of Canada geoscientist, John Shaw, had a brainwave. What if that was exactly what happened? What if a gravel bar (such as we see everywhere around these previously glaciated coasts) had prevented Minas Basin from marine flooding, ‘holding out’ – if you wish – until some catastrophic event (a storm, likely) breached it after which it the gravel bar never repaired itself again as its remains were constantly attacked by ever-higher tides.
Oddly (or not), the Miqmaq have a legend about their spiritual chief, Glooscap, who wanted to take a bath and asked the beaver to build him a bathtub. Which the beaver did (gravel bar). When he was done with his bath, Glooscap asked beaver to empty the bath, but we know how stubborn beavers are and this beaver was no different, so he refused. Glooscap got mad, threw a couple of rocks at beaver (small islands along the north shore of the basin) and eventually asked the Whale ‘to flip his tail’ and empty the tub. Which the whale did.
Now the former bath tub fills and empties twice every lunar day – and we watch it from our house. John Shaw’s article is referenced below.
I would have loved to sit on top of Cape Blomidon during the event that destroyed this hypothetical gravel bar and watch it happen. The tidal currents are so powerful that no evidence exists of this former gravel bar, so it remains a speculative story, except for those radiocarbon dates.
Would my presence at that time have had any influence on the future evolution of the area? Not my individual presence, not even the presence of a few thousand MiqMaq who lived here at the time. But if this would have happened in the 20th century, society might have intervened, it might have decided that the gravel bar needed protection, locals might have gone about some big engineering construct to ‘keep Minas Basin fresh’ (I can just see the bumper stickers).
And that brings the story back to the human dimension that the WordPress challengers were thinking of.
Reference
Shaw, J., C.L. Amos, D.A. Greenberg, C.T. O’Reilly, D.R. Parrott, E. Patton, 2010, Catastrophic tidal expansion in the Bay of Fundy, Canada. Canadian Journal of Earth Science, v. 47, p. 1079-1091.
Posted in General geoscience, Nova Scotia
Tagged Canada, Chixculub, Deccan Traps, DPChallenge, extinction, Glooscap, Holocene sea level rise, Ice Age, K-T extinction, Minas Basin, MiqMaq, Quaternary, tides, time travel
1 Comment
Canadian Earth Science for @PMHarper 3 – the importance of finding layered oceanic crust
The preamble to this review series is here.
Gillis, K.M., J.E. Snow, A. Klaus, N. Abe, A.B. Adriao, N. Akizawa, G. Ceuleneer, M.J. Cheadle, K. Faak, T.J. Falloon, S.A. Friedman, M. Godard, G. Guerin, Y. Harigane, A.J. Horst, T. Hoshide, B. Ildefonse, M.M. Jean, B.E. John, J. Koepke, S. Machi, J. Maeda, N.E. Marks, A.M. McCaig, R. Meyer, A. Morris, T. Nozaka, M. Python, A. Saha, R. Wintsch, 2014, Primitive layered gabbros from fast-spreading lower oceanic crust. Nature, v. 505, p. 204-208
The earth has just two types of crust: continental crust and oceanic crust. Continental crust forms most of the continents. Oceanic crust forms most of the oceans. The earth is like a cracked sphere consisting of a dozen or so pieces of moving oceanic and continental crust. The pieces are called plates and their dynamical interaction is called plate tectonics (from ancient Greek, meaning “pertaining to construction”). We have known about plate tectonics for just 50 years. Plate Tectonics explains everything about the earth’s crust, but while we know this to be the case, it doesn’t mean we have found every explanation for every observation as yet.
Plates move around today and have been doing so for close to 4 billion years (the earth is a little over 5 billion years old). There are only three possible plate movements: plates can move away from each other (spreading), they can collide, and they can slide alongside each other. Plates spread at (mid)ocean ridges where magma wells up and accretes on two sides of a zipper line. This process creates oceanic crust. The best known example of spreading is the Atlantic Ocean that has a beautiful zipper line in the center from where the ocean grows at about 2-3 cm per year (more or less the rate at which your finger nails grow) increasing the distance between the continents. Spreading usually isn’t accompanied by very volatile earthquakes and volcanic eruptions.
Because the earth as a sphere doesn’t get any bigger or smaller, the result of spreading (which increases plate size) is that shrinking must take place elsewhere. Shrinking goes through collision and the most famous collision zones are along the Pacific margin where oceanic crust disappears below continental crust, giving us the ‘ring of fire’ with lots of earthquakes and volcanoes. The most famous area where plates slide alongside each other is along the San Andreas fault in California and along the Great Anatolia fault in Turkey.
But even the Pacific Ocean, which is shrinking as we speak, still has are spreading ridges. Consider the figure below.

Map of the earth’s plates, and their rate of motion in cm/year. The higher the number, the faster the motion. Spreading is shown as opposite facing arrows, collision as arrows pointing to each other and and sliding as half arrows in opposite direction. Note that there is pretty consistent spreading along the length of the Atlantic Ocean and a combination of spreading and collision (subduction) at widely varying rates along and in the Pacific Ocean. The red arrow points to the Hess Deep, the area where the authors collected their samples. Figure 4.1 from Moores and Twiss (1995)
Because these processes have gone on for such a long time, many previously existing plates have disappeared over the eons, they are consumed into more recent plates through collision and sliding processes. How do we know? Because we find pieces of oceanic crust (with a distinct, unique combination of minerals) incorporated in continental rocks. Such pieces of oceanic-crust-now-on-land are called ophiolites and they are studied intensely as they give us a unique window into understanding the history of the earth.
The figure below shows the locations of ophiolites in the world. The most famous one in Canada is right in Gros Morne National Park and this was in fact one of the main reasons for designating the national park as well as getting a UNESCO World Heritage status. The Bay of Islands ophiolite is an important piece of Canadian geoheritage.

The research project that this article presents was carried out as ‘Legs 345’ of the Integrated Ocean Drilling Program using the drill ship JOIDES Resolution. JOIDES stands for Joint Oceanographic Institutions for Deep Earth Sampling, the largest international cooperative earth science program in the world which has been going on since 1968.
Leg 345 sampled a fast spreading centre in the eastern Pacific, known as the “Hess Deep”. This project was a successor to Leg 147, which sampled the same area in 1993. Bear in mind that the average depth of the ocean here is 4 km.
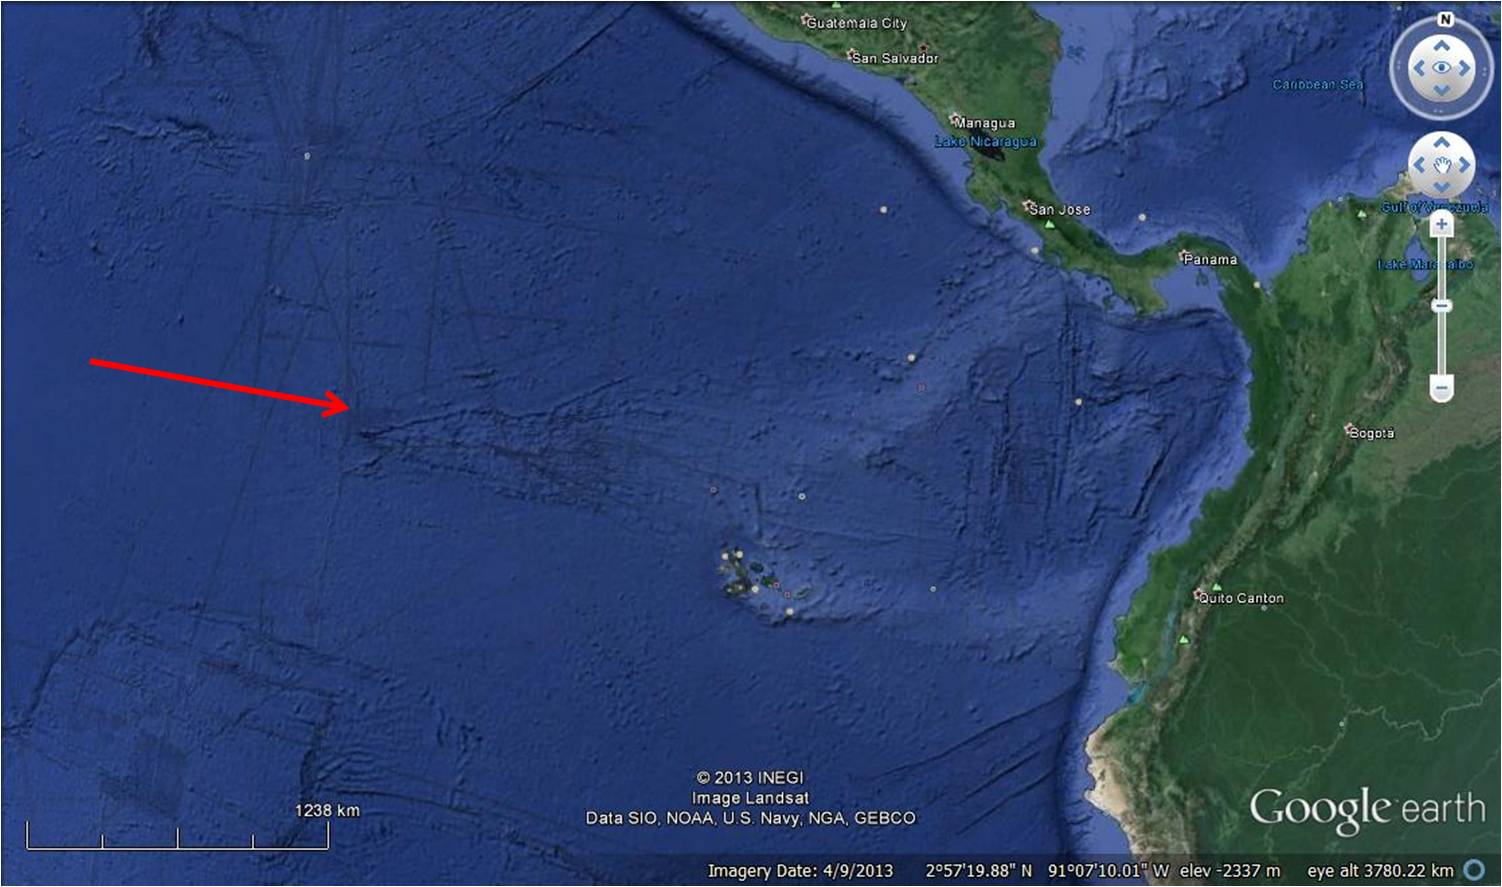
Location of the “Hess Deep” spreading centre in the eastern equatorial Pacific Ocean.
The expedition had two chief scientists: Dr. Jonathan Snow of the University of Houston and Dr. Kathryn Gillis of the University of Victoria. Kathryn Gillis also led the earlier Leg to the same area in 1993.

Expedition co-leaders Jonathan Snow (left), Kathryn Gillis (centre) and core curator Chad Broyles (right) aboard the JOIDES Resolution during the expedition. Image source here
Why drill here? To see if they could find the type of oceanic crust that was thought to be typical for fast spreading centres. Why is that important? Because three-quarters of the world’s oceanic crust formed at fast-spreading ridges. Why should we care about that? Because of two reasons:
- for the intrinsic value of pure discovery. In this case, discovery that will improve our understanding of the history of the earth.
- because many of the earth’s important and valuable minerals occur in rocks that were once part of the oceanic crust. If we can better understand how the oceanic crust formed, we’ll improve our understanding of mineral occurrences.
Bonanza was granted the researchers. The drill ship retrieved oceanic crust with a layered appearance and a unique mineral composition that tells us much about the properties of the molten lower crust, how it differentiates as it solidifies and what this means for interpreting plate movements.

This piece of core is about 5 cm across and about 12 cm long. It shows alternating light and dark layers of gabbroic rock. These rocks – the first of their kind to be recovered – help confirm a long-standing belief that the gabbroic rocks in the lowermost part of the oceanic crust are layered. These layers are defined by the relative abundance of the minerals olivine, clinopyroxene, and plagioclase; differences in the mineral content gives each layer its light and dark appearance. Image courtesy Kathryn Gillis – figure from the article, accessible online (with this figure caption) here.
It’s a big achievement to be an IODP (co)-chief scientist. Kathryn Gillis is an outstanding geoscientist and is featured as one of the world’s leading women oceanographers here.
===
The IODP is an astonishingly productive program, initiated in 1968 by the United States only five years after the theory of plate tectonics was formulated. The only individual countries that are full members are the United States, Japan, Korea, Australia/New Zealand, and China. The European Union is a full member too. Canada was a full member, but withdrew some years ago. Canada now operates under the auspices of the European Union membership (see www.iodp.ca for more details). This is embarrassing because Canada, the world’s second largest country bordering three oceans, has as much voice in IODP as any small European member country. Which is not a full voice, that’s for the full members. Despite the remarkable achievements of Canadian scientists, we don’t really count in this international arena.
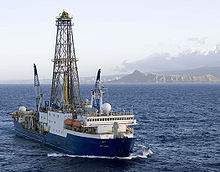 The JOIDES Resolution drill ship
Reference
Moores, E.M. and R.J. Twiss, 1995, Tectonics. W.H. Freeman and Co., New York, 415 p.
Blue Beach is not for sale
(Originally posted in March 2014. Updated a few times, last in May 2017)


Left: Google Earth image showing location of Blue Beach – Avonport Station coastline. Right: aerial photo of the cliff (in the shade) and beach at low tide.
One of the world’s prime fossil locations, Nova Scotia’s iconic Blue Beach, hit the press recently (here and here) although readers outside Nova Scotia or readers not familiar with paleontology may not have noticed. As a result, confusion arose among the public and even among some of my followers, so here is a bit of background (NOTE: This post was originally published on March 17, 2014. On May 11, 2014, Blue Beach hit the press again in the Chronicla Herald (here) in relation to the research visit by world-renowned paleontologist Dr. Jenny Clack, who visited the site; on May 13, the Chronicle Herald published another piece here).
“Blue Beach” is informally named.
The cliffs along Blue Beach are exposed in rocks of the Tournaisian Horton Group which here represent shallow fluvio-lacustrine deposits forming the edge of the early Carboniferous Maritimes Basin which was located at a tropical latitude at the time. The Tournaisian lasted from 359-345 million years ago. It was a very interesting time interval in earth history, because this is when the first 4-footed vertebrate animals (i.e. with a spine just like us) set foot on land. A 4-footed vertebrate is generically known as a ‘tetrapod’ (‘tetra’ is Ancient Greek for ‘4’, ‘pod’ means ‘foot’). If you don’t find the whole animal, but just its footprints, then you usually can’t tell whether the animal is an amphibian or a reptile (or a mammal, for that matter, but mammals didn’t exist yet in the Carboniferous) so you call it a tetrapod. If you find a whole series of footprints of what obviously was a 4-footer wandering through life, you call it a ‘trackway’, as in ‘tetrapod trackway’.

Tetrapod trackway from Blue Beach. Figure from Mossman and Grantham, 2008
This short 15 million year time interval is also known as ‘Romer’s Gap’. It’s named after the scientist (Alfred Romer) who identified the interval as a crucial period in earth history: few 4-footed vertebrates existed earlier than 360 million years ago and many of them went extinct at the end of the Devonian, the period during which fishes were especially abundant (the UNESCO World Heritage site at Miguasha in Quebec is testimony to that ‘age of fishes’). The first true reptiles are found in sedimentary rocks younger than 345 million years. In fact, the world’s oldest reptile (fossil) is also from Nova Scotia – it was found at Joggins Fossil Cliffs, now a UNESCO World Heritage Site (www.jogginsfossilcliffs.net). It’s called Hylonimus Lyelli and is Nova Scotia’s provincial fossil. The oldest sedimentary rocks at Joggins are ca. 345 million years old. So big evolutionary changes happened in a relatively short period of time. Fishes went on land, amphibians evolved, reptiles evolved, all in the blink of an eye – that’s putting it a bit too simplistic, but you get the idea. Unfortunately, the world doesn’t have a lot of exposed sedimentary rocks from that period, so our understanding suffers from a gap. Hence “Romer’s Gap” (the Wikipedia entry is really good).
The rocks exposed between Blue Beach and Avonport Station are one of the few locations on earth that represent exactly that time interval. The paleo-environment was ideal for preserving remnants of life at the time: it was a shoreline at the mouth of probably multiple river systems. The body of water in which these rivers emptied may have been fully saline, it may have been brackish to fresh. In other words, a fertile environment. Lush vegetation grew on land, much of which wasn’t eaten, as there were no large land animals and no birds. As the vegetation died (and much of the dead vegetation that became buried eventually became coal), it supplied the soils with organic detritus and thus with plenty of nutrients, so the area teemed with life. Rapid sedimentation in a subsiding basin (the Maritimes Carboniferous Basin) ensured that dead bodies (plant or animal) were quickly buried: an ideal condition for preservation. In addition, the area was subsiding as it was part of a rapidly opening and deepening sedimentary basin, so the thick sediment packages became quickly buried, out of reach of other destructive forces.
So the rocks at Blue Beach – Avonport Station are the showcase for an entire ecosystem. Amazing!
Fast forward 360 million years to today: the rocks are exposed along the Minas Basin, a side arm of the Bay of Fundy, which experiences the world’s highest tides. Along this stretch, the average tide range is about 12 m. This makes for a perfect 3D exposure along km-wide low-tide rocky and muddy beaches and in the cliff, which is up to 20 m high in places. The tides erode these soft shales rapidly – new discoveries are constant.
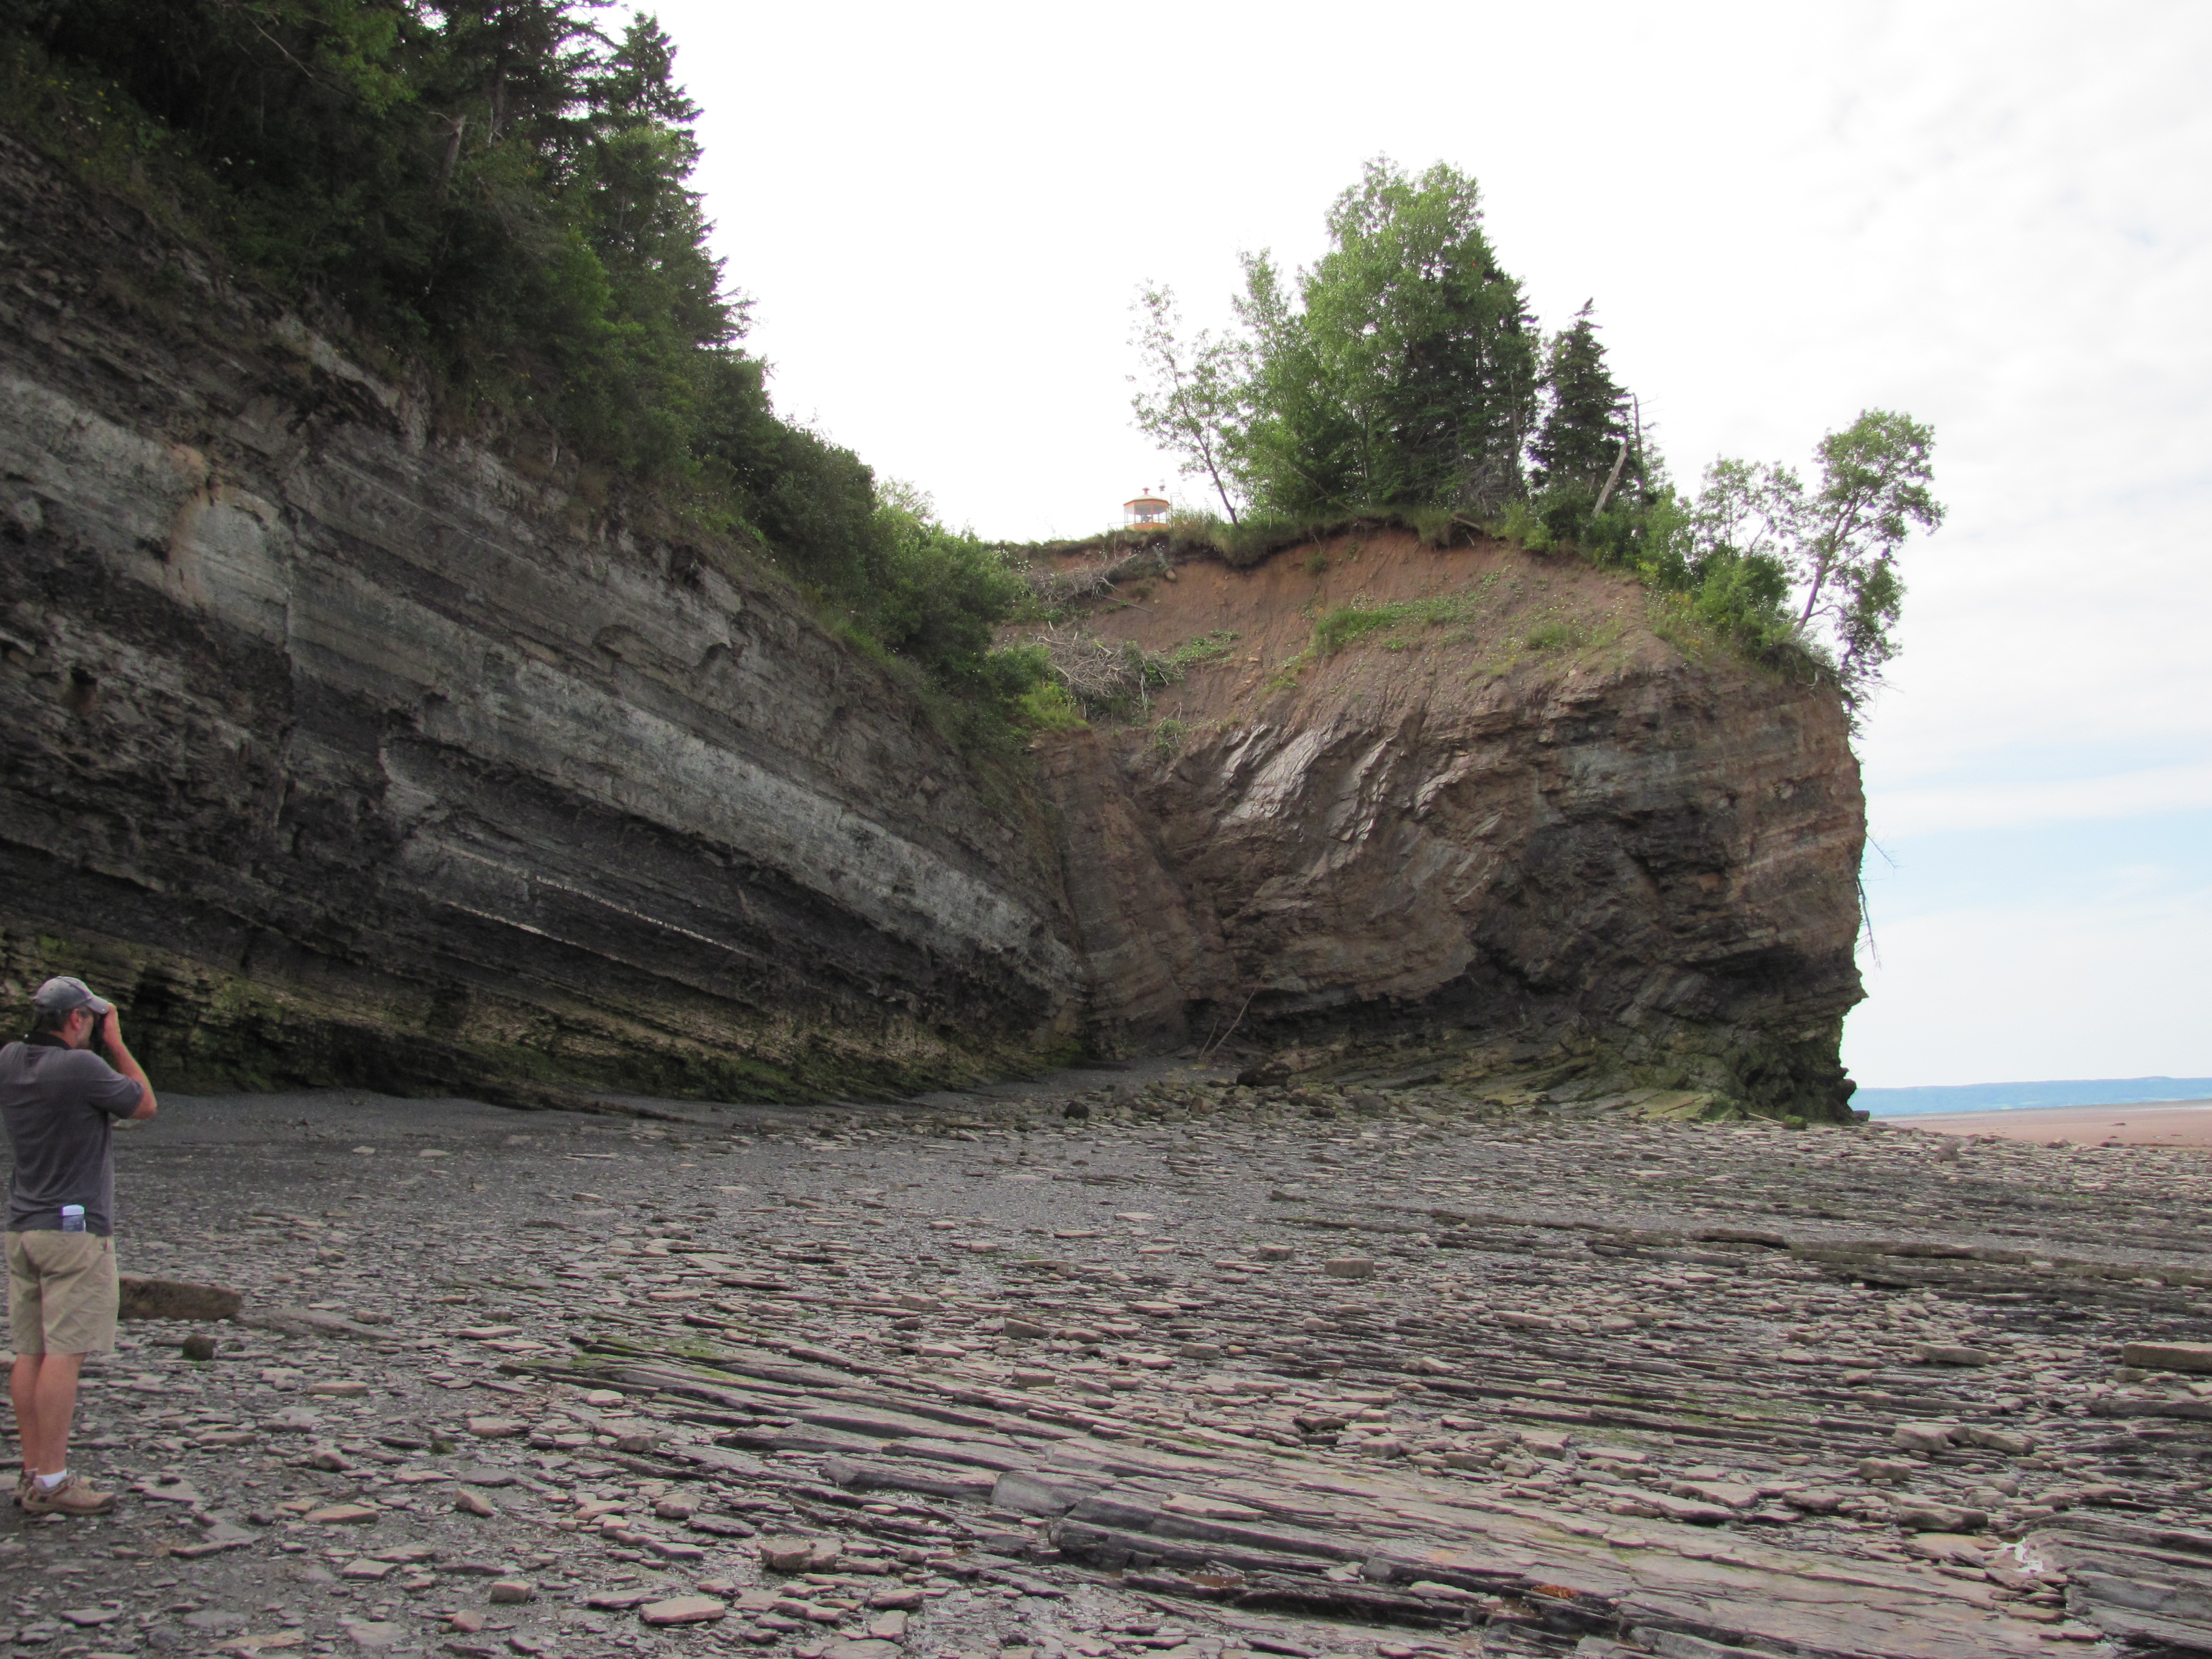
Blue Beach – excellent 3D outcrop! There is minor faulting and deformation in the shales, but virtually no diagenetic alteration.
Protecting our geoheritage
Nova Scotia has an amazing geodiversity, covering about 1 billion years of earth history. Not all of this Geoheritage (see Nova Scotia Geoheritage Map here) contains evidence of evolution of life (fossils), but a lot of it does. The province has been the hunting ground of professional paleontologists for nearly 200 years! Realizing that much of our unique fossil heritage could be carted away easily, the province created a law in 1974 called the ‘Special Places Protection Act’. Without going in to too much detail, this law basically declares every fossil the ownership of the people of Nova Scotia, i.e. the province. No fossil can be private property. Now, there are lots of fossils that the province is not interested in, such as gazillions of raindrop imprints or mud-cracks or fish scales. But it’s worded in an extreme way so that you can’t take off with any fossil (raindrop or tetrapod trackway) and claim that you didn’t know about that being an illegal act. I live approximately 4 km from Blue Beach, so have wandered there frequently and found 1 special fossil, the tail piece of a trilobite. I handed it over to the Nova Scotia Museum of Natural History, where it is catalogued and where anyone can come to study and admire it.

A trilobite pygidium (tailpiece) that I found at Blue Beach – it is now at the Nova Scotia Museum of Natural History
Such a law is difficult to police, of course, especially in a thinly populated place with wild coastlines. I remember visiting Arizona’s Petrified Forest and every visitor is essentially guarded by an interpreter / park warden to make sure that nobody picks up anything. Excellent. But we can’t do that here, it is logistically and financially impossible. (there was a sentence here that stated that Neil Shubin et al, who found the most important early dinosaur bones at Nova Scotia’s Parrsboro shore in the early 1980s, collected these bones and took them to Chicago without further ado, but I was notified by Neil Shubin himself that I was wrong, so that sentence is no longer here. Do read the comments below and do read Neil Shubin’s ‘Your Inner Fish’).
So the law is good, but its operationalization is weak.
Only a few people have properties on top of the cliff above Blue Beach. If you own property on the coast in Nova Scotia, you own it to the high tide line. So even if your property borders a site such as Blue Beach, those fossils aren’t even close to being yours (the law aside) because the highest high tide comes halfway up the cliff.
Sonja Wood and Chris Mansky own a property on top of the cliff at the entrance to Blue Beach. Chris Mansky is a well-known amateur fossil hunter and I don’t mean amateur in a negative way. He is one of those rare individuals without formal training and with an extremely keen eye. Two other equally famous amateur fossil collectors in Nova Scotia are Don Reid and Eldon George. Over the decades, Chris Mansky has rescued an amazing array of unique fossils from being destroyed by the tides. He and Sonja have stored these fossils in a Quonsett hut on their property and have shared their findings generously with anyone who wished to see them – a lot of those were school kids but Chris was also made co-author on a number of scientific articles by professional paleontologists who researched Blue Beach (professionals are allowed to collect for research purposes if they apply for a heritage collections permit from the NS Department of Communities, Culture and Heritage; anything they find is than catalogued by the NS Museum). Chris and Sonja only asked for donations. The fossils are not theirs, as they make very clear on their website (http://www.bluebeachfossilmuseum.com). They can’t be sold.
Sonja and Chris have made various attempts at creating a visitor and interpretation centre on their land, including getting money promised by the county. An architect created a design for a museum. But the money didn’t come through so I can only assume that none of these plans is considered viable any longer, so they have put their property up for sale. That’s too bad. (In 2022 the property is no longer for sale and they still live there; there is no movement on the interpretive centre).
The question is, of course, what will eventually happen to “their” collection, which legally belongs to the province and could – theoretically – be moved to the provincial storage facility at Stellarton, a good 3 hours driving away. That would be really sad, because while the province (Nova Scotia Department of Communities, Culture and Heritage through the Nova Scotia Museum of Natural History) would of course (as they are mandated by law to do) provide access to the collection to scientists, it would be inaccessible to the general public, unless the Museum organizes a specific exhibit. Our small and thinly populated province doesn’t have money for remote interpretation centres. Such initiatives require separate funding.
Sites such as Blue Beach are important for public education and for furthering the collective understanding of our the history and evolution of life on earth and they are part of our Geoheritage. While the Blue Beach-to-Avonport stretch of coastline is unaffected by all this uproar, it would be a really good idea if there was an interpretation centre that conserves and showcases the fossil collection in the area itself rather than somewhere further away where visitors can’t relate to the environment. The museums and interpretation centres at Joggins and at Parrsboro are testimony to that principle. They each get tens of thousands of visitors each year and are not only visitor sites, but also research facilities. The beach at Joggins is now more protected from illegal fossil hunting than before because paid interpreters are on the beach during the warmer part of the year, guiding visitors and poring over their finds. This is a positive development.
So I do hope the collection made possible by Sonja and Chris’s efforts can be made available for public viewing in a centre somewhere as close as possible to Blue Beach itself. Since Sonja and Chris do not own the collection, it’s clear that the location of an interpretation centre doesn’t have to be on their property, because the collection isn’t theirs. Also, the cliffs and beach are not endangered by the intended sale of their property.
References
Calder, J.H., 1998, The Carboniferous evolution of Nova Scotia. In: Blundell, D.J. And A.C. Scott (eds.), Lyell, the past is the key to the present. Geological Society, London, Special Publications , v.143, p. 261-302
Clack, J. A., 2002, An early tetrapod from “Romer’s Gap”. Nature, v. 418, 4 July 2002, p. 72-76.
Gibling, M.R., N. Culshaw, M.C. Rygel and V. Pascucci, 2008, The Maritimes Basin of Atlantic Canada: basin creation and destruction in the collisional zone of Pangea. In: Sedimentary Basins of the World, V. 5, p. 211-244 (Elsevier).
Hunt, A.P., S.G. Lucas, J.H. Calder, H.E.K. Van Allen, E. George, M.R. Gibling, B.L. Herbert, C. Mansky and D. Reid, 2004. Tetrapod footprints from Nova Scotia: the Rosetta Stone for Carboniferous tetrapod ichnology. Geological Society of America, Abstracts with Programs, v. 36, no. 5, p. 66
Martel, A.Th. and M.R. Gibling, 1992, Wave dominated lacustrine facies and tectonically controlled cyclicity in the lower Carboniferous Horton Bluff Formation, Nova Scotia, Canada. In: Anadon, P., L.L. Cabrera, K. Kelts, Lacustrine Facies Analysis, Int’l Assoc. of Sedimentologists special publication no. 13, p. 223-240.
Martel, A.Th. and M.R. Gibling, 1996, Stratigraphy and tectonic history of the upper Devonian to lower Carboniferous Horton Bluff Formation, Nova Scotia. Atlantic Geology, v. 32, p. 13-38
Mossman, D.J. and R.G. Grantham, 2008, Eochelysipus horni, a new vertebrate trace fossil from the Tournaisian Horton Bluff Formation, Nova Scotia. Atlantic Geology, v. 44, p. 69-77
Tibert, N. E. And D.B. Scott, 1999, Ostracodes and agglutinated foraminifera as indicators of paleoenvironmental change in an early Carboniferous brackish bay, Atlantic Canada. Palaios, v. 14, p. 246-260.
The Eemian and the #Anthropocene

Figure 1. River Eem at town of Eemdijk (to the right), Netherlands. The view is to the North. Eem floodplain (ca. 1 m below MSL) to the left. Location of photo: 52o15’17.65″N, 5019’38.42″E
The Eemian interglacial warm period is known as the Sangamonian in North America and as Isotope stage 5e in paleoceanographic and climatic circles. It followed the Saale/ Illinoian glacial period.
The Eemian lasted from ca. 130,000 – 115,000 years ago and was followed by the most recent glacial period (Weichselian/Wisconsinan), which lasted until about 11,000 years ago when the current warm period, the Holocene began.
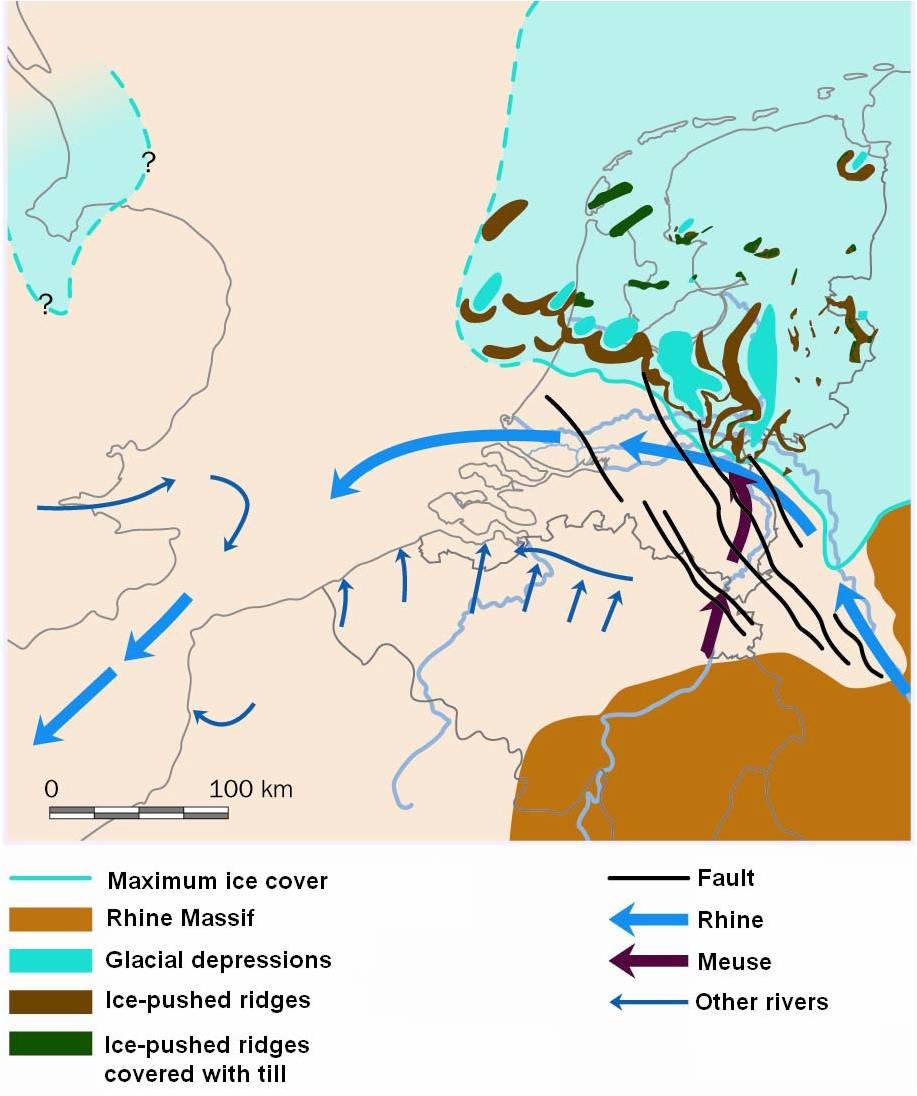
Figure 2. ‘Maximum ice cover’ is the maximum ice cover of the Saale/Illinoian glacial period. The ‘Glacial Depressions’ shown on this figure are Saalian in age and were inundated by the subsequent Eemian Sea (see figure 3). The Weichsel/Wisonsinan ice cap didn’t reach as far South as those of the Saale glacial. ‘Ice-pushed ridges’ are moraines. The ‘faults’ are part of the tectonic fabric of the failed rift system of the Rhine/North Sea. Figure from Vlaar, 2007

Figure 3. Maximum extent of the Eemian sea. Figure from Vlaar, 2007
The Eemian interglacial was on average about 2degC warmer than the Holocene has been so far. There have been other periods in Earth history that have been lots warmer, but the Eemian is so young that it is therefore especially relevant to study. Why? Because continental configurations were the same as today, so that it becomes possible to model and understand the oceanographic and atmospheric conditions of this period. A better understanding of the Eemian is essential for enabling better models for future global warming. Lots of scientists research aspects of the Eemian interglacial. Here I only mention the NEEM project here (www.neem.dk). NEEM stands for North Greenland Eemian Ice Drilling, an international ice core research project aimed at retrieving an ice core from North-West Greenland (camp position 77.45°N 51.06°W) reaching back through the previous interglacial, the Eemian.
Few people know that the Eemian is named after the River Eem in the Netherlands. Full disclosure: I grew up in a town on the River Eem (not the one in the picture) and spent my high school years rowing skiffs, doubles and 4-s on the river. My first job was a paper route which required bicycling many long hours along the river, delivering the local rag to the dispersed farms. The graphic artist M.C. Escher lived in that area too. One of his better known images is ‘Day and Night’ which might very well have been inspired by the landscape along the Eem river
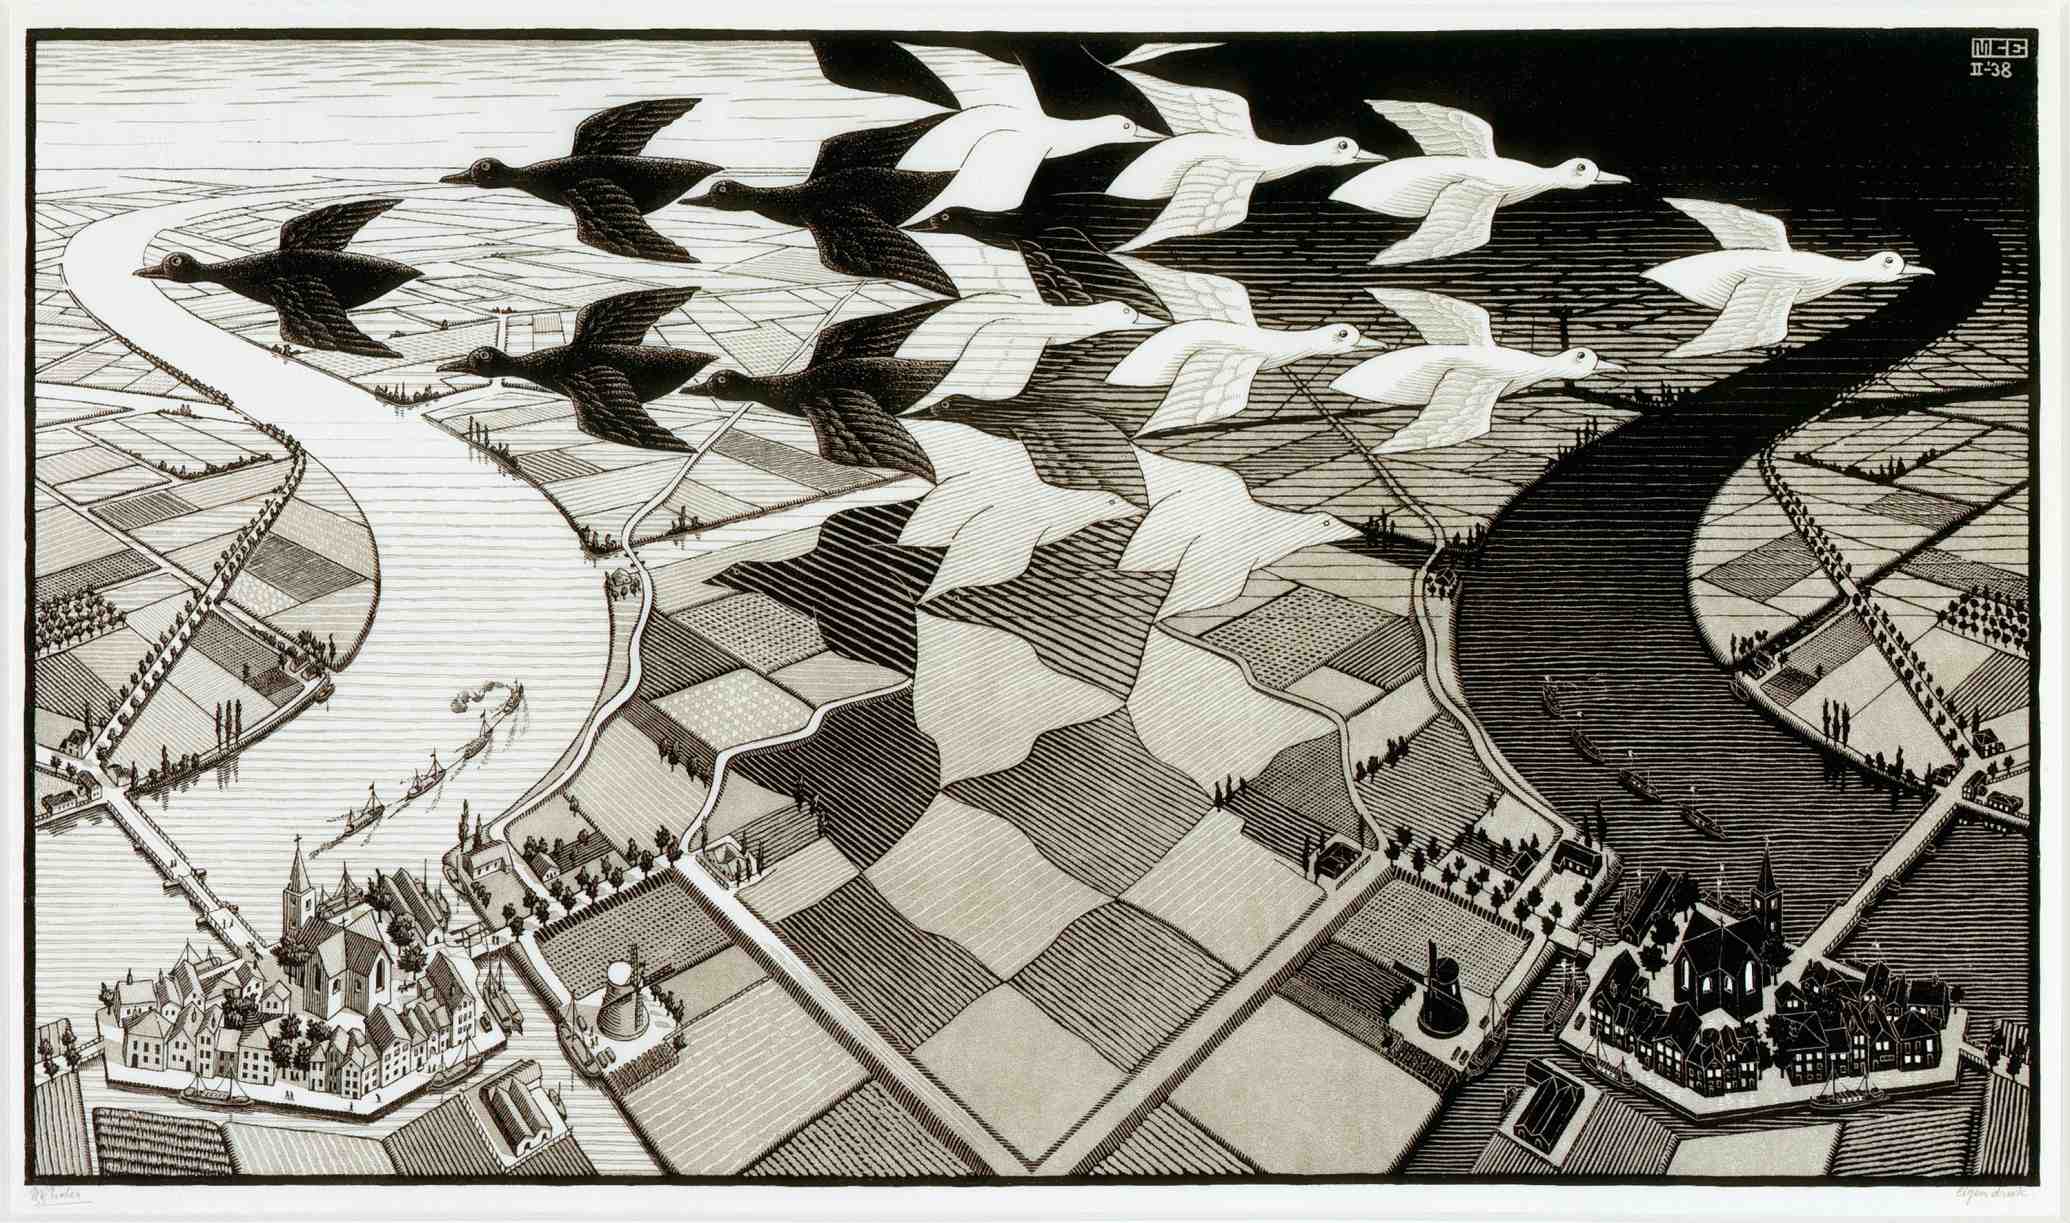
M.C. Escher: ‘Day and Night’ – possibly inspired by the Eem River valley landscape
It’s barely a river with its total length of 18 km and 10 km wide surrounding floodplain. But this little valley bears superb testimony to our fluctuating climate and to the creativity of humankind to deal with adverse conditions.

Figure 4. Digital elevation model of the central Netherlands, showing the terminal moraine of the Saalian/Illinoian ice cap and the River Eem, draining the interior moraine valley to the North. Source: www.ahl.nl. The western portion of the Saalian terminal moraine is known as the ‘Heuvelrug’, its eastern portion as the ‘Veluwe’. Even though the moraine was breached by melt water near at its southern tip, its inner valley drains mostly northwards through the River Eem and the ‘Lunterense Beek’, a somewhat longer river that is largely rerouted as a canal (not indicated on figure).
The Eemian/Sangamonian lasted only about 20,000 years, a relatively short time for an interglacial warm period. Eemian global mean sea level (MSL) stood ca. 4-6 m higher than present-day (Holocene) Mean sea level and global mean temperature was about 2degC higher than at present (the ‘present’ is changing rapidly of course). Of course, climate is warming and sea levels are rising rapidly since the last 200 years but it’s still safe to state that Eemian MSL stood about 2m above Holocene MSL.
When sea level rose during the Eemian interglacial, the North Sea flooded these lowlands and the bowl-shaped inner valley of the moraine became a shallow marine embayment, a natural receptacle for sediments washing in from the surrounding the inner slopes of the moraine (Figure 3.)
The moraine consists of gravel-loaded sands, loams and clays and was thus very susceptible to erosion prior to during early deglacation when the climate was still Arctic (tundra) and without much vegetation. Washed down slope sediments interfinger with marine sediments deposited in the Eem floodplain. This package of sediments tells us the story of the changing environmental conditions over time so well that it became the designated type locality for the Eemian interglacial.
After its short journey, the Eem empties in the former “Zuiderzee” tidal basin, renamed the “IJsselmeer” after it was isolated from the tidal sea by a 31 km barrier in 1932. The Dutch subsequently reclaimed a large portion of the IJsselmeer. The southern edges of these reclaimed land areas are visible in Figure 4.
Early people started settling here a little more than 1000 years ago. The town of Amersfoort (literally meaning ‘ford across the Eem/Amer, where ‘Eem/Amer’ means ‘water’) became a logical site for a trading post with the river Eem as its commercial access route as well as for beer brewing, thanks to reliable access to clear water. The river continued to have a commercial function until well into the 1960’s: when we rowed on the river in those years, we learned to manoeuver our skiffs in the wake of the barges that barreled empty and high upriver and full and low downriver. By that time, the river was very polluted: our parents warned us never to go swimming.
Because of its economic importance, it became essential that the river had a consistent water level and thus it became enclosed in artificial levees (‘dykes’) from the early Middle Ages onwards. The floodplain, now isolated from sediment-laden seasonal flooding, was pumped dry using windmills (first) and power-driven pumping stations (later). Its sediments compacted and its elevation sank to below sea level. It always remained relatively wet, however, and thus was and is used predominantly for grazing dairy cattle and for producing hay.
Times change – these days, the river is purely a recreational ribbon in the landscape. Also, dairy farming no longer has the economic significance it used to have. A significant part of the Netherlands is man-made; the country has an extremely high population density, so there is little room for nature. Changing economic conditions such as along the Eem are opportunities for re-instating a bit of nature: these days the floodplain of the Eem is allowed to regain some wetland characteristics, attracting large flocks of different species of geese, wild swans, herons and many other birds.

Small-scale water management in the Eem floodplain using wind and solar power. New wetland showing as water patches in the distance. Large-scale wind turbines on the horizon.
Growing up here, I never knew anything but a man-made landscape. I lived in the Anthropocene before that term was invented. The Dutch were and are hailed as the prime example of a people who have conquered nature. They must continue to do so if they want to keep their feet dry (2/3 of the Dutch population, ca. 10 million souls, live below sea level). Where possible, they now try to work with nature rather than against it because they have learned that the land otherwise becomes sterile. And they have become innovative in enabling the return of once considered worthless wetlands. They try to make room for rivers, some wildlife AND for green energy projects. It’s optimistic, it’s hopeful.
As I see it, the Anthropocene started here more than 1000 years ago. People continued to adapt to hostile circumstances and their adaptations have been novel and innovative and they have been able to improve them over time (the Eem floodplain was definitely not a bird sanctuary in the 1960’s). People are tenacious and creative, and this makes me hopeful about the future. Areas such as this can be an inspiration for well-designed interventions that will be needed to survive in the Anthropocene that now confronts everyone.
References:
http://en.wikipedia.org/wiki/Eem http://members.upc.nl/t.meijer64/paginas/ae-pub-eem_BCM.htm
Bosch, J.H.A., P. Cleveringa and R. Meijer, 2000, the Eemian stage in the Netherlands: history, character and new research. Netherlands Journal of Geosciences, v. 79 no. 2/3, p. 135-145. This article can be accessed at: http://members.upc.nl/t.meijer64/paginas/ae-pub-eem_BCM.htm
NEEM Community members, 2013, Eemian interglacial reconstructed from a Greenland folded ice core. Nature, 493, pp 489-494. http://www.nature.com/nature/journal/v493/n7433/full/nature11789.html
Vlaar, M., 2007, Reconstruction of the Palaeo-ecology of the Eem Polder by means of dendrochronology, pollen and macrofossil analysis. Unpublished MSc thesis, Utrecht University. http://vkc.library.uu.nl/vkc/archaeology/SiteCollectionDocuments/Scripties/2007/Marije%20Vlaar/MA%20Thesis%20Marije%20Vlaar%202007.pdf
Posted in General geoscience
Tagged Anthropocene, Climate Change, Eem, Eemian, Glacial, Interglacial, Netherlands, Quaternary, Sea Level
1 Comment
Canadian Earth Science for @PMHarper – 2: The Canadian contribution to the International Polar Year
The preamble to this review series is here.
—
Melling, H., R. Francois, P.G. Myers, W. Perri, A. Rochon, R.L. Taylor, 2012, The Arctic Ocean – a Canadian perspective from IPY. Climate Change, DOI 10.1007/s10584-012-0576-4. Published online at http://link.springer.com/article/10.1007%2Fs10584-012-0576-4/fulltext.html
The fourth International Polar Year, coordinated by the International Council for Science and the World Meteorological Organization, lasted from March 2007 to March 2009. It was a global scientific effort in which thousands of scientists from more than 60 countries collected data for more than 150 research projects, an enormous accomplishment.
Poles and oceans play a critical role in controlling climate, a globally relevant issue of which the details are still only partially understood. Big questions such as what parameters exactly control climate, how stable climate systems are and how quickly they can destabilize can only be answered through reams of minutely executed projects, defined on the basis of carefully articulated research questions. Eventually, the combined results of these effforts will lead to universally valid answers.
The Canadian contribution to this IPY was typically Canadian! Canadian scientists “wanted to contribute in a constructive manner to the larger international effort”. The Canadian IPY activities “were linked with those of other countries in order to advance Arctic marine science and move it closer to societal relevance, public policy and applications” and were focused exclusively on the Arctic.
It’s important to be aware of how completely different the earth’s polar regions are. The North polar region is an ocean surrounded by continent masses, whereas the South polar region is a continent surrounded by ocean. You can’t think of more opposing conditions. Water absorbs heat in a much different way than land, so the Arctic’s role in governing climate is bound to be much different from that of Antarctica. In addition, the Arctic Ocean is unusual compared to other oceans because a relatively large portion of it is occupied by shallow (less than 500 m deep) continental shelf (light blue in the figure below). A continental shelf is the portion of a continent that is permanently flooded by the ocean. Shallow waters warm more easily than deep waters, so the shelves of the Arctic Ocean are like hot water bottles along its sides.

This article summarizes seven research projects that were carried out along a 13,000 km ship trajectory from Victoria to Halifax, traversing the three oceans that Canada borders (aptly named C3O). The ships from which the data were collected were Canadian coast guard vessels that were on their scheduled Arctic patrols. Talk about a win-win opportunity. Research is expensive, doing research in the Arctic is hideously expensive, so if you can reduce that expense by making use of paid-for ship time, you’re a genius in my book. By designing the research along this trajectory, the scientists established a baseline for future studies.
Quick primer to oceanography. If you have never thought about why and how ocean currents flow, there are two things you must remember:
- There are surface currents and deep currents. Surface currents are largely driven by wind (weather!), additionally pushed around by the rotation of our planet. Surface currents occupy the top 50-200 m of the oceans and their temperature is mostly controlled by the sun. Deep currents occupy the rest and since the world’s oceans have an average depth of 4000 m, that’s a lot of water that’s difficult to observe.
- The movement of the deep ocean water is driven by differences in density between water masses, again heavily influenced by the rotation of our planet. What causes density differences? Only two parameters to remember for the purpose of this blog post: salinity and temperature. Mean global ocean salinity is 35 parts per million (ppm). What makes for variability in salinity? Climate: in lower latitudes, average air temperature is relatively high, the water evaporates and the remaining water body becomes more salty. Salty water has a higher density than fresh water, so if the two come in contact, the salty water will sink below the fresh water. Warm water absorbs more gases from the atmosphere than cold water, hence warm water is less dense than cold water and thus cold water will sink below warmer water.
Do surface and deep water never mix? They sure do. To keep with the main topic of this paper, I will mention only the situation in the North Atlantic. There, the warm, salty waters of the Gulf Stream (named for the warm and thus salty Gulf of Mexico where it originates) meet cold polar waters. The salty water cools, becomes more dense, and sinks below cold (less salty) surface waters, then flows back South as deep water, supplementing the deep ocean with oxygen along the way. The linked system of surface and deep ocean currents is called the ‘global conveyor belt’, a term coined by the iconic oceanographer Wallace Broecker (Lamont Doherty Geological Observatory, NY).
Now, let’s look at the 13,000 km study area discussed in this paper. This figure shows the trajectory and sampling stations of the Canadian IPY trajectories.

The Yellow Line is the ship track, officially called the C3O section. Other sampling stations (not discussed in this blog post) are represented by circles etc. Surface currents are represented by arrows: pink for warm, white for cold.
The Arctic Ocean is in contact with the Pacific ocean via the Bering Strait and with the Atlantic Ocean via the Davis Strait (between Baffin Bay and the Labrador Sea). It also receives a lot of (seasonally changing) fresh water from the surrounding continents, most of it from large rivers. On our side of the Arctic, these are the Mackenzie and the Yukon.
Because of a couple of unique conditions in the Northeastern Pacific, the water flowing into the Bering Strait is relatively fresh (lower salinity) compared to that of the Arctic Ocean. It’s also full of nutrients that support the food chain there. In addition, its elevation is about 40 cm above that in the Beaufort sea. As a result, the flow of ocean water from the Bering Strait to the Davis Strait is like a giant river flowing down an extremely gentle gradient. This “river in the ocean” receives additional fresh water from northern rivers, so it stays relatively fresh thus less dense along the way. In the past, it would gradually become more saline because of the formation of pack ice: when ice forms, fresh water is taken out of the ocean water body, thus increasing the salinity of the remaining sea water (and also reducing the temperature at which it freezes). But in the last decade, the surface waters remain relatively fresh and this expedition contributed to understanding why that happens
Here are the results:

The C3O section of seawater temperature (top) and salinity (bottom), measured in July 2008.
These diagrams are 2 dimensional (distance/depth) cross sections of the ship trajectory showing the variability of the two most crucial oceanographic parameters temperature and salinity. The vertical scale on these diagrams is pressure, which you can pretty much translate to depth 1:1.
Take a good look: the upper cross section shows the temperature variation along the trajectory. Clearly, the North Pacific is relatively warm (red). Once these waters enter the Arctic Ocean through the Bering Strait they remain recognizably warm until somewhere between the Amundsen and Coronation Gulf, nearly 8,000 km further. At that point, the surface waters become significantly colder as they become mixed with the relatively fresh, cold waters of the “Beaufort gyre”, a surface current that rotates in a clock-wise direction in the Beaufort Sea. Until a few years ago, the Beaufort gyre was permanentaly capped by sea ice.
The relatively fresh and recently ice-poor Beaufort gyre also influences the salinity along the same part of the transect, as shown in the lower diagram: from the Beaufort Sea to Coronation Gulf, salinities are only about 2/3 of mean ocean salinity.
These observations were supported by measurements on other tracers, such as the element Barium. Barium is a tracer of river water and its concentration was very low during the IPY observation years, which supported the conclusion that the observed freshening of the water along the transect was caused by influx from the changing position and behaviour of the Beaufort gyre.
Lots of other significant discoveries were made along this IPY transect. I can’t dwell on them more, or this post becomes as long as the article itself. Therefore only a short summary of the conclusions:
- the Canadian Arctic climate shows asymmetric cyclic variability in the last 10,000 years. During warmer intervals, there is less ice in the western Arctic and this coincides with more ice in the east and vice versa.
- Wind is a crucial influence on water movements
- When ice is far from shore, winds, waves and storm surges create hazardous conditions for coastal communities. Decreasing summer ice thus increases vulnerability of these settlements.
- Changes in the outflow from the Arctic to the Atlantic Ocean influence the global water cycle.
- There is more fresh water in the Canada basin during the last decade than before and this causes a decrease in nutrient supply, which affects the very base of the food chain.
Canada is one of only a handful of nations bordering the Arctic Ocean. Global climate is changing rapidly and Arctic research is more important than ever. It is therefore more than a little embarrassing that Canada still hasn’t moved on the replacement of its aging ice breakers, as reported here
Tantalum, your smart phone and the world economy
I listen to BBC World Service a lot. Today I caught the program “More or Less” (http://www.bbc.co.uk/programmes/b006qshd), presented by Tim Harford.
“More or Less” is about “the numbers and statistics used in political debate, the news and everyday life”.
Today’s first part of the program discussed important numbers of 2013. The first guest was Dr. Pippa Malmgren, a highly respected American policy maker and recognized Global leader (http://en.wikipedia.org/wiki/Pippa_Malmgren).
Dr. Malmgren’s favourite number for 2013 was 73, the periodic table number for the element Tantalum, “one of the rare earths” and these elements are very important, because they are essential components of mobile phones and computers and thus critical for the modern economy. Dr. Malmgren went on to explain that critical minerals are minerals with a limited supply. The issue with being able to produce them is whether there is enough investment to “pull these minerals out of the ground”. She explained that it takes about 15 years before a Tantalum or a Phosphate mine (she mentioned phosphate because it is a fertilizer) sees a return on capital and this is generally way too long for investors, so it’s difficult to raise the money to develop such projects. She then jumped from critical minerals to the shortage of talent “to dig these things out of the ground”. As a result of this global talent shortage, new graduates from the Colorado School of Mines, “America’s best engineering school”, are expected to make higher starting salaries than those of the Harvard business school for the first time ever this coming year. This, she thought, was important, because it might motivate “those with a talent for math” towards engineering degrees (essential for the “real economy”) instead of towards finance and business degrees where everybody was drawn to in the past “because that’s where you made the most money”.
Well, that’s a lot! Let’s peel the onion on this one.
About Tantalum
First of all, Tantalum is not a a rare earth element. The rare earths are the Lanthanoids (nos. 57 through 70) plus Scandium (21) an Yttrium (39). Rare earth elements aren’t rare, by the way, they are plentiful in the earth’s crust, but they tend to occur very diluted in deposits together with lots of other elements. While Tantalum is not a Rare Earth element, it does also occur very diluted: its crustal abundance is 0.7 g/ton (http://minerals.usgs.gov/minerals/pubs/commodity/niobium/myb1-2011-niobi.pdf). So you truly have to dig large volumes of rock to get a reasonable amount of one particular element. And if there is no or limited use for the other elements in the deposit, then you end up with a lot of useless waste. Hence there is a lot of R&D going on that focuses on finding uses for some of the other elements in such deposits. A Tantalum-Niobium International Study Centre with nearly 100 organizational members exists since 1974 with headquarters in Belgium (http://tanb.org).
According to the United States Geological Survey’s commodity database “Tantalum is ductile, easily fabricated, highly resistant to corrosion by acids, and a good conductor of heat and electricity and has a high melting point”. (http://minerals.usgs.gov/minerals/pubs/commodity/niobium/). Easy to see that it’s useful for fine manufactured products such as mobile phones, computers and automobile electronics. Tantalum is not the only unusual element in your smart phone, there is a host of others, but I’m not getting into those in this post.
Tantalum is typically found in pegmatite veins. Pegmatite veins look spectacular in outcrop, because they tend to have very large crystals, due to the fact that they originate by dewatering of metamorphic rocks (these are rocks that are altered from their original state due to being exposed by very high temperatures and/or pressures) or by hot alteration of certain magmas (magmas are rocks that result as the lithification of original crustal melts). The picture shows an example of such a pegmatite vein: the man is putting his hand on a single crystal of K-feldspar (a very common mineral) at the Ruggles pegmatite mine near Grafton (NH, USA). http://www.newark.osu.edu/facultystaff/personal/jstjohn/Documents/Rocks-and-Fossils-in-the-Field/Ruggles-Pegmatite.htm

Finding such veins in the subsurface requires the skills of specialized geologists. And that is where Dr. Malmgren erred: because no matter how good the engineers that graduate from the Colorado School of Mines (an excellent school indeed), engineers don’t “find stuff” – geologists do. The School of Mines produces geologists as well, as do hundreds or other schools in the US and another three dozen or so in Canada.
Tantalum hasn’t been produced in the US since more than 50 years, so it imports it mostly from Australia, Brazil, and Canada, but a lot of the Tantalum that the US imports is actually produced from recycled foreign and domestic scrap (http://minerals.usgs.gov/minerals/pubs/commodity/niobium/mcs-2013-tanta.pdf).
Tantalum mining in Canada
I have found three Tantalum prospects/mines in Canada:
1. Tanco Mine near Bernice Lake (Manitoba). This is an old mine (the deposit was discovered in the 1920s) and it’s nearing depletion, the quality of the resource is decreasing. Early last year, 40% of its workforce was laid off (http://www.winnipegsun.com/2013/03/13/tanco-mine-near-lac-du-bonnet-laying-off-40-of-staff).
2. War Eagle mine in Northwest Territories (http://www.wareaglemining.com/s/MACTantalum.asp). Here is an excellent photo of typical pegmatite veins at the War Eagle deposit (http://www.wareaglemining.com/s/Image.asp?i=photos/mac/6meterClimbingWall.jpg&id=78627.)

3. The Lilipad Lakes mine of Avalon Rare Metals in Northern Ontario (http://avalonraremetals.com/projects/lilypad_lakes/) another pegmatite. Here is an excellent illustration of the size and concentration of the resource:

Tantalum mining in/and the rest of the world
Unfortunately, about 50% of the world’s Tantalum is mined artisanally in countries with troublesome human rights records, notably the Democratic Republic of Congo. The excellent website http://www.mining.com contains a superb video by a German non-profit (Edeos) on “the real price of a smart phone”: http://www.mining.com/video-from-production-to-disposal-whats-the-life-of-a-smart-phone-actually-like-38873/. Full disclosure: yes, I have a smart phone, and a tablet and a pc. I know.
Dr. Malmgren gave the impression that finding and producing these resources is simply a matter of making sure that there are enough talented engineers (and geoscientists) to find the stuff and enough investors to pay for pulling it out of the ground. I’m sure that this impression on my part is caused by the fact that her contribution was only a few minutes of radio time. Because I’m equally sure that a woman of her stature realizes that future critical resources aren’t simply produced by more people and more money.
Personally, I believe that no matter the talent and no matter the money, there will be increasing conflict and dragging of heels over earth resources in the near and more distant future: indigenous peoples are increasingly standing up for their human rights, their land rights and their labour rights. All people are standing up for environmental protection. Countries and corporations won’t be able to just bulldoze (literally) over people because of profits. The mining industry knows this and works hard at improving its practices. The Prospectors and Developers Association of Canada has the E3 Plus program (http://www.pdac.ca/programs/e3-plus), to help exploration companies improve social, environmental and health&safety practices. But the dialogue and protests over the Keystone and Northern Gateway pipelines, over hydraulic fracturing of shale gas, over blood diamonds and blood Tantalon are, I believe, only the first steps in forging completely new ways of managing our earth’s resources.
Posted in General geoscience
Tagged BBC, Canada, economy, electronics, environment, indigenous, mining, rare earths
1 Comment
Canadian Earth Science for @PMHarper – 1: The end of the last Ice Age off Newfoundland
The preamble to this review series is here.
Roger, J., Saint-Ange, F., Lajeunesse, P., Duchesne, M.J., and St-Onge, G., 2013, Late Quaternary glacial history and meltwater discharges along the Northeastern Newfoundland shelf. Canadian Journal of Earth Sciences, v. 50, p. 1178-1194. dx.doi.org/10.1139/cjes-2013-0096 .
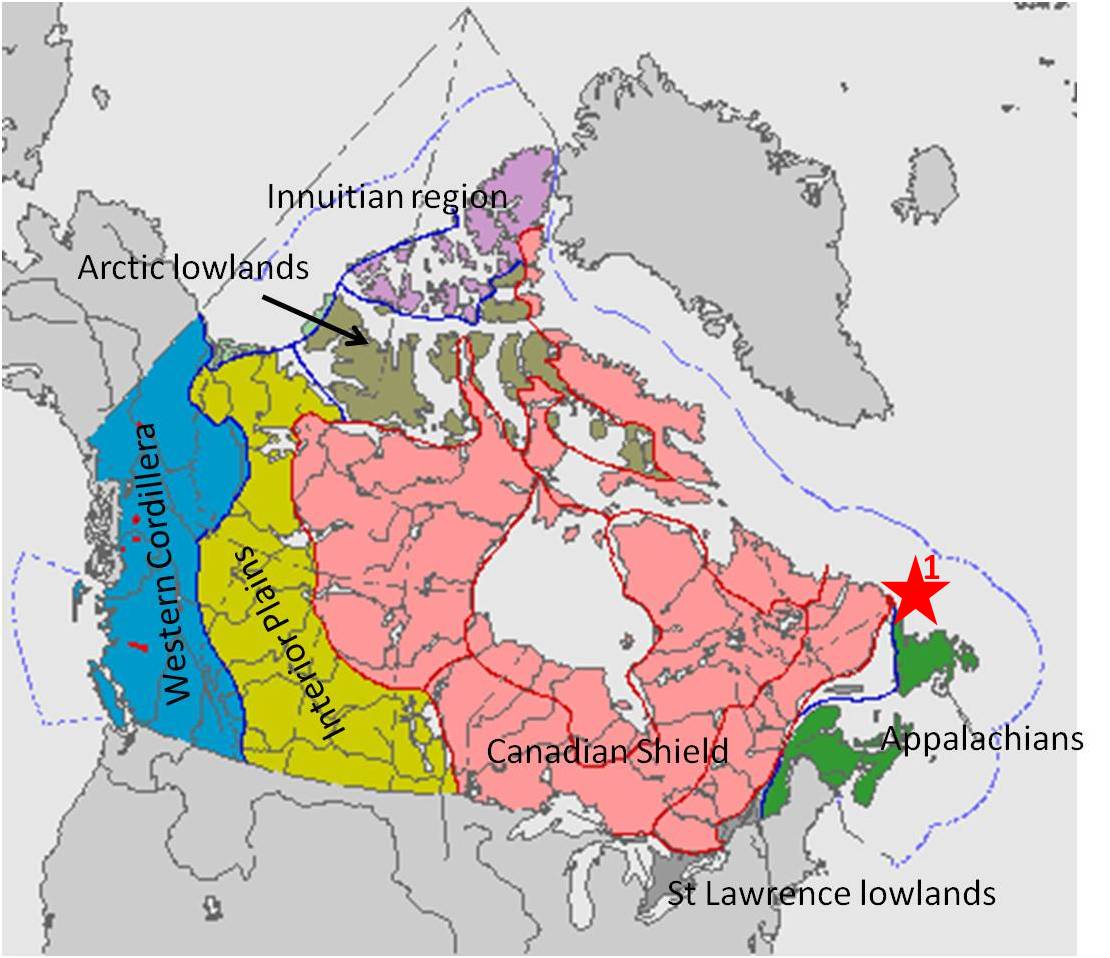
Physiographic map of Canada (from the National Atlas of Canada: http://atlas.nrcan.gc.ca/site/english/). Red star indicates the location of this study
For this first review, I turned to the most recent issue of the Canadian Journal of Earth Sciences. Bingo! This title jumped out at me right away: it covers not only a subject close to my own heart, it’s also research about Atlantic Canada, home for me.
The authors asked: what happened during the final warming stages of the last Ice Age along Northeastern Newfoundland ?
The last Ice Age was pretty much over 10,000 years ago. But the change from cold to warm took a while. Warming tentatively started about 30,000 years ago, lumbered along for a while, then really sped up since ca. 12,000 years ago.
Ok, so that happened a while ago, and it’s long behind us. Why do we need to know more than this?
History matters: by improving our understanding of the complex processes that took place in northern seas during the last climate warming, we can improve the models that predict the future on our rapidly warming planet. And such models are essential tools for mitigating future risks.
Aside from improving climate models, shipping lanes and drilling platforms are at risk of exposure to sudden marine hazards, such as the ones discussed in this article.
Here are the main conclusions of this paper:
- the ice margin of NE Newfoundland began to retreat some 30,000 years ago. During this first phase of melting, the ice cap was still frozen to the substrate. Massive amounts of chaotic debris piled up seaward of the shelf margin, often very rapidly
- by ca. 17,000 years ago, the ice cap was no longer frozen to the substrate, allowing it to retreat a lot faster than before. During this phase, more organized sediment flows (called turbidites) piled up on top of the previously deposited chaotic sediment.
- the Newfoundland ice dome melting phases happened at different time intervals than the Labrador ice dome melting phases (so close, yet so different!)
Let’s dive in for the details:
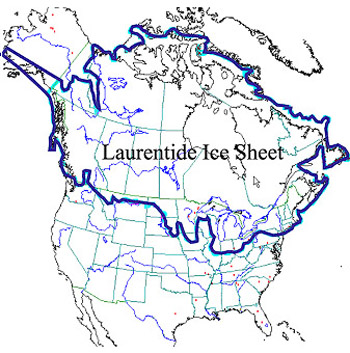
Maximum extent of the most recent continental ice cap ca 20,000 years ago. Image source here
When a whole continent is covered by an ice cap and the climate starts warming up, the ice doesn’t melt nicely and evenly from around the outer edges. The Laurentide Ice sheet reached all the way south to Indiana and Ohio, so – logically – melting was faster in Southern areas than farther North. Also, the thickness of the ice cap varied across the continent and the underlying emerging relief determined how and where meltwater could flow, and this again influenced the new topography. Massive amounts of debris get washed out of a melting ice cap, debris that the ice has scraped off from the underlying land and ground to bits. This debris piles up. The photo below is a good illustration of how messy that looks

North Side of the Russell Glacier, Greenland. Photo Peter Broz. Although most of what you see appears to be debris, the hill that you’re looking at is actually the tip of a glacier.
Newfoundland is the far NE corner of our continent. Today, the seafloor off northeastern Newfoundland slopes gently down at less than 1o until about 200 m water depth. The edge of the shelf (called the shelf margin) is defined where the angle of slope steepens to about 1.5o until it reaches depths of ca. 4500 m. You ask: these are slopes? Yes they are: under hundreds and thousands of meters of water, even such miniscule slope angles strongly influence the movement of bodies of ocean water and sediment.
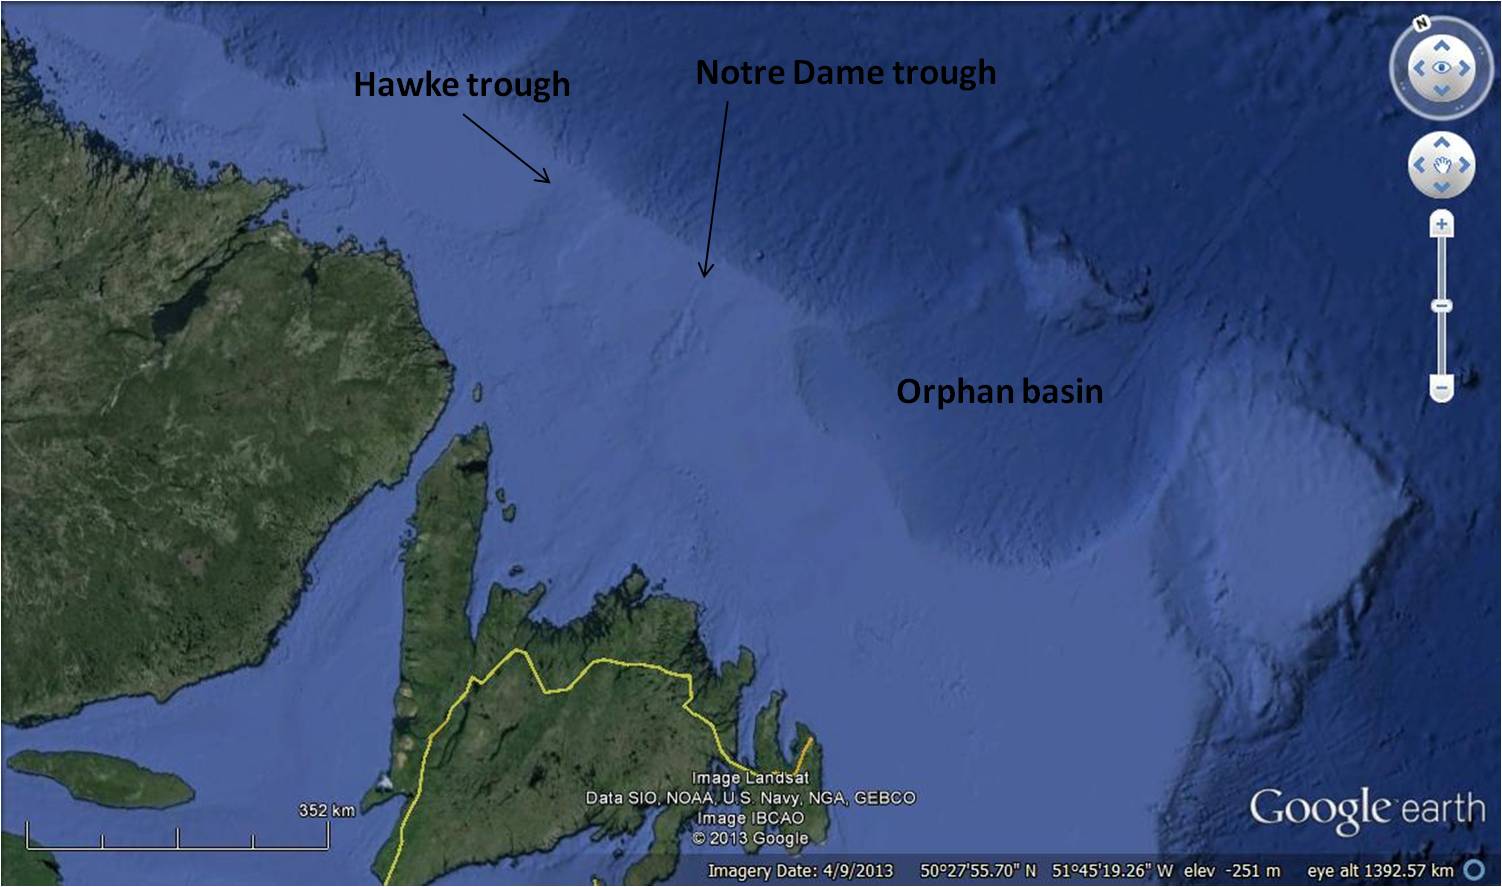
The NL shelf today. The Hawkes and Notre Dame troughs and the sediment piles on their seaward side were the subject of this study. Image: Google earth (I am not using the figure from the article, because I’m not sure whether I would be violating copyright, even though the research was funded by NSERC and the GSC).
As the ice cap over Newfoundland (the “Newfoundland dome”) melted and the Strait of Belle Isle became ice free, melting ice, loaded with sediment, began to concentrate and move in a northeasterly direction, eventually dumping piles of sediment off the shelf margin.
As the melt water channeling increased off Newfoundland, the flows first incised the sediment body while it was being deposited and then even incised underlying bedrock. The sediment body is called a Trough Mouth Fan (TMF). TMFs are wedge-shaped sediment bodies at the mouth of a trough. The TMFs in this area are called the Hawkes and Notre Dame TMF, piled up at the mouths of their respective troughs.
We’re talking BIG features here: The Notre Dame TMF is 200×100 km (pretty much the same size as the southern Nova Scotia mainland where I live), the Hawkes only marginally smaller. That’s just the TMF! Not even counting the canyon
The goal of the research was to improve understanding of the timing and exact processes of deglaciation. There is a good chance that these TMFs contain answers to that question, because so much sediment was deposited so rapidly. In general, the biggest problem in piecing together the history of the earth (which is what geoscientists do), is that there are more gaps than evidence. The famous British geoscientist Derek Ager once compared the global geologic record to a fishing net: “lots of holes tied together with string”. What he meant by that analogy was this: if you were an alien from another planet and you found some string, would you be able to figure out the function of the fishing net? Probably not. Geoscientists often feel like these proverbial aliens: all we get is a bit of string.
Even though these TMFs likely hold the clues for what happened during this time interval, it’s very hard to get at the evidence. The water depth ranges from hundreds to thousands of meters and the weather is generally not cooperative, so you need a sturdy ship. For this study, a few hundred kilometers of seismic data and 6 cores were collected during a 2010 summer cruise with CCGS “Hudson”.
Describing these cores visually (they are split lengthwise) requires an experienced, trained eye. Over the years, protocols have been developed for logging cores. In addition to visual descriptions, the cores are examined with x-ray radiography (just like your chest x-ray). Also, microscopic organisms with calciferous skeletons are sampled for radiocarbon dating, enabling the determination of absolute ages of the sedimentary layers.
The study area of this paper lies to the NW of the Orphan Basin, which was the subject of research in earlier years. I was lucky enough to be able to take my Dalhousie and Acadia University undergraduate earth science students for a lab to the Bedford Institute of Oceanography (BIO) in Dartmouth for several years. As you know (but not all readers of this blog may know), BIO is the home of the Geological Survey of Canada / Atlantic and the home base of the CCGS Hudson. My students were given the opportunity to examine the cores from the Orphan Basin (see reference below). The first look on their face upon seeing the seemingly homogeneous mass of sediment was always one of complete bewilderment. There was nothing to see! It was just mud! Then they got into it, but that’s another story.
So, an area the size of the southern Nova Scotia mainland, and all you have is 6 pin pricks (cores) and some seismic data. It’s testimony to the intelligence and tenacity of researchers over the years that any conclusions can be drawn at all from so little information.
Of course piecing such analyses together doesn’t just take a small ship board party, one summer and a few months of writing up. The authors (who are from universities in Quebec and from the Geological Survey of Canada) refer to several dozen other articles that substantiate and supplement their analyses. The papers they refer to date back to the 1970s, and this means that this is pretty new research. Before that time, we simply didn’t have the technology to do studies like this.
Indeed, 40+ years of painstaking work by dozens and dozens of people and it’s still pretty new research. That’s how science works.
Reference
Tripsanas, E K; Piper, D J W; Jarrett, K A, 2007, Logs of piston cores and interpreted ultra-high-resolution seismic profiles, Orphan Basin. Geological Survey of Canada, Open File 5299, 339 pages; 1 DVD, doi:10.4095/223224. Full report link here
CCGS Hudson
The CCCGS Hudson is Canada’s oldest and most famous research vessel, built in 1960 on the occasion of the opening of the Bedford Institute of Oceanography. The Canadian ship building procurement (announced in October of 2011) includes for the Hudson to be replaced. The original announcement was for the replacement ship to be completed in 2014. This has now been postponed to 2016.
