The preamble to this review series is here.
Roger, J., Saint-Ange, F., Lajeunesse, P., Duchesne, M.J., and St-Onge, G., 2013, Late Quaternary glacial history and meltwater discharges along the Northeastern Newfoundland shelf. Canadian Journal of Earth Sciences, v. 50, p. 1178-1194. dx.doi.org/10.1139/cjes-2013-0096 .
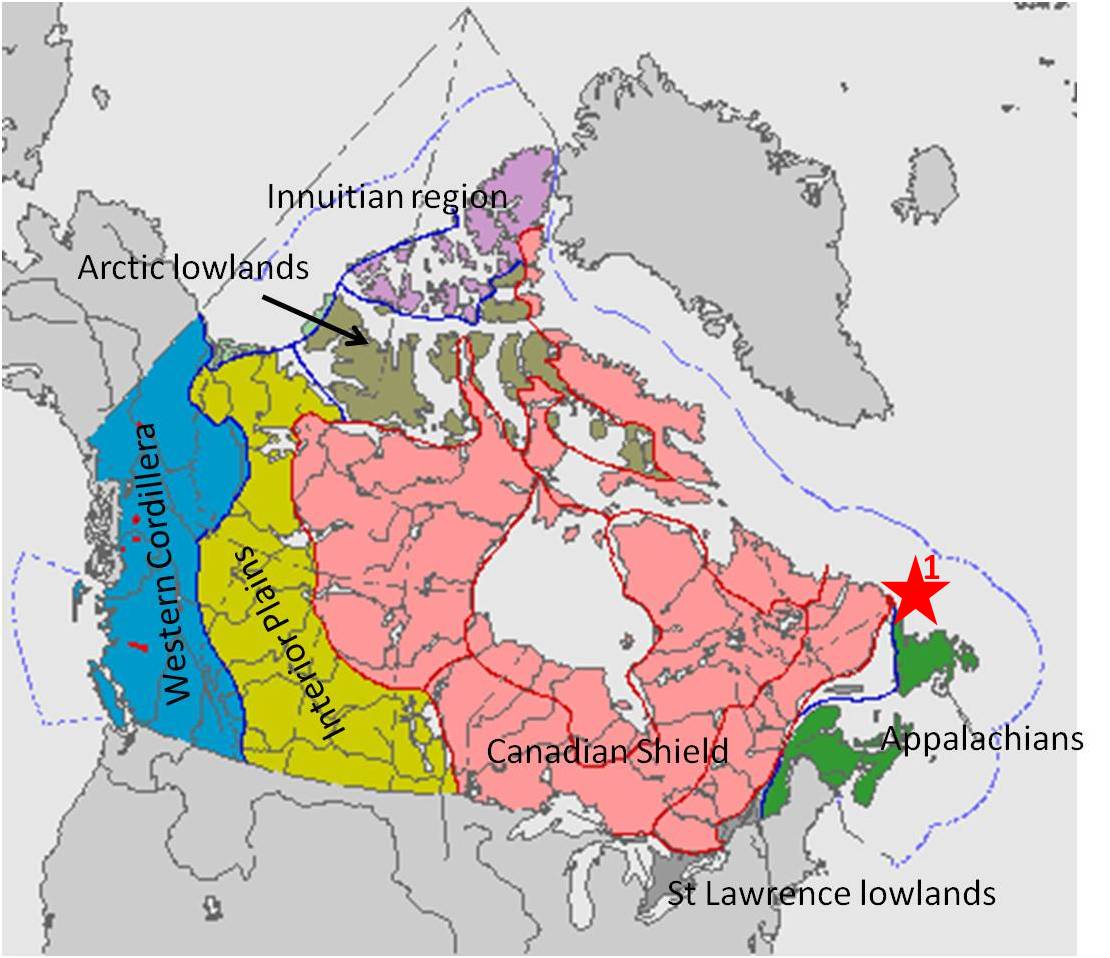
Physiographic map of Canada (from the National Atlas of Canada: http://atlas.nrcan.gc.ca/site/english/). Red star indicates the location of this study
For this first review, I turned to the most recent issue of the Canadian Journal of Earth Sciences. Bingo! This title jumped out at me right away: it covers not only a subject close to my own heart, it’s also research about Atlantic Canada, home for me.
The authors asked: what happened during the final warming stages of the last Ice Age along Northeastern Newfoundland ?
The last Ice Age was pretty much over 10,000 years ago. But the change from cold to warm took a while. Warming tentatively started about 30,000 years ago, lumbered along for a while, then really sped up since ca. 12,000 years ago.
Ok, so that happened a while ago, and it’s long behind us. Why do we need to know more than this?
History matters: by improving our understanding of the complex processes that took place in northern seas during the last climate warming, we can improve the models that predict the future on our rapidly warming planet. And such models are essential tools for mitigating future risks.
Aside from improving climate models, shipping lanes and drilling platforms are at risk of exposure to sudden marine hazards, such as the ones discussed in this article.
Here are the main conclusions of this paper:
- the ice margin of NE Newfoundland began to retreat some 30,000 years ago. During this first phase of melting, the ice cap was still frozen to the substrate. Massive amounts of chaotic debris piled up seaward of the shelf margin, often very rapidly
- by ca. 17,000 years ago, the ice cap was no longer frozen to the substrate, allowing it to retreat a lot faster than before. During this phase, more organized sediment flows (called turbidites) piled up on top of the previously deposited chaotic sediment.
- the Newfoundland ice dome melting phases happened at different time intervals than the Labrador ice dome melting phases (so close, yet so different!)
Let’s dive in for the details:
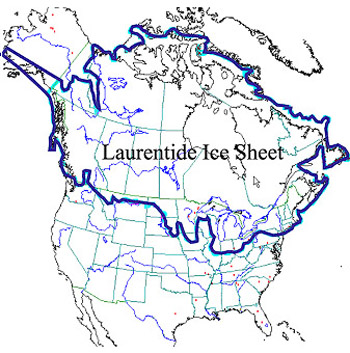
Maximum extent of the most recent continental ice cap ca 20,000 years ago. Image source here
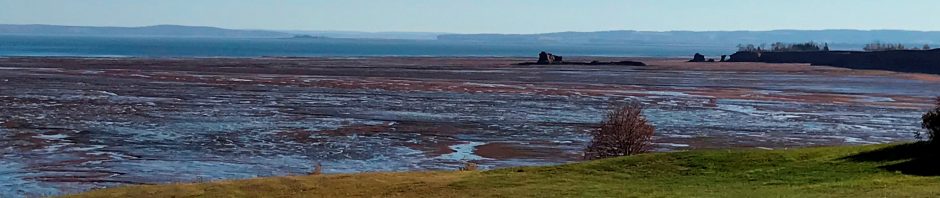
When a whole continent is covered by an ice cap and the climate starts warming up, the ice doesn’t melt nicely and evenly from around the outer edges. The Laurentide Ice sheet reached all the way south to Indiana and Ohio, so – logically – melting was faster in Southern areas than farther North. Also, the thickness of the ice cap varied across the continent and the underlying emerging relief determined how and where meltwater could flow, and this again influenced the new topography. Massive amounts of debris get washed out of a melting ice cap, debris that the ice has scraped off from the underlying land and ground to bits. This debris piles up. The photo below is a good illustration of how messy that looks

North Side of the Russell Glacier, Greenland. Photo Peter Broz. Although most of what you see appears to be debris, the hill that you’re looking at is actually the tip of a glacier.
Newfoundland is the far NE corner of our continent. Today, the seafloor off northeastern Newfoundland slopes gently down at less than 1o until about 200 m water depth. The edge of the shelf (called the shelf margin) is defined where the angle of slope steepens to about 1.5o until it reaches depths of ca. 4500 m. You ask: these are slopes? Yes they are: under hundreds and thousands of meters of water, even such miniscule slope angles strongly influence the movement of bodies of ocean water and sediment.
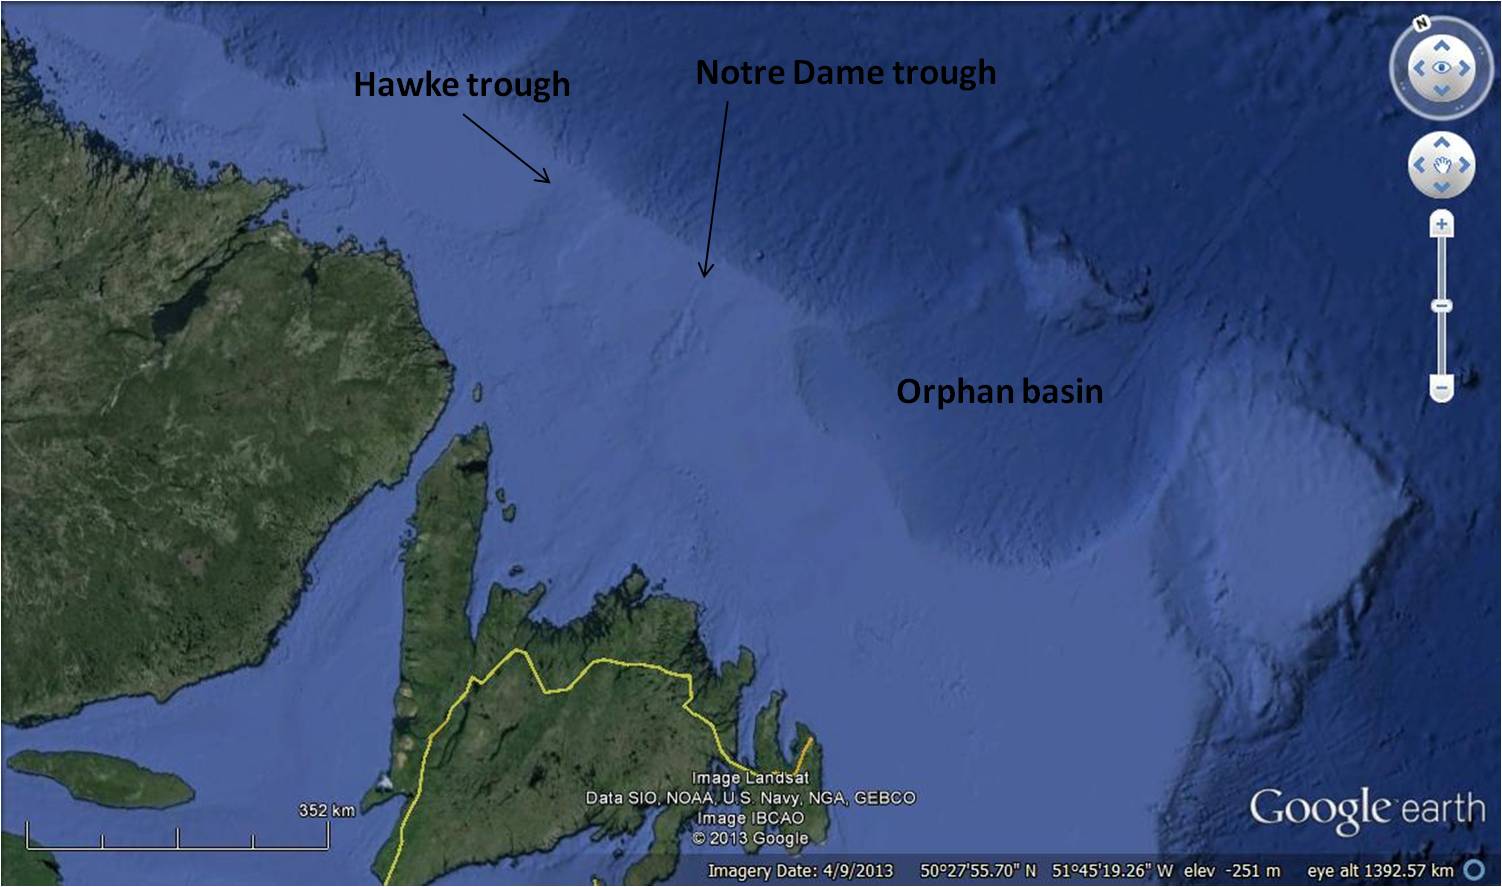
The NL shelf today. The Hawkes and Notre Dame troughs and the sediment piles on their seaward side were the subject of this study. Image: Google earth (I am not using the figure from the article, because I’m not sure whether I would be violating copyright, even though the research was funded by NSERC and the GSC).
As the ice cap over Newfoundland (the “Newfoundland dome”) melted and the Strait of Belle Isle became ice free, melting ice, loaded with sediment, began to concentrate and move in a northeasterly direction, eventually dumping piles of sediment off the shelf margin.
As the melt water channeling increased off Newfoundland, the flows first incised the sediment body while it was being deposited and then even incised underlying bedrock. The sediment body is called a Trough Mouth Fan (TMF). TMFs are wedge-shaped sediment bodies at the mouth of a trough. The TMFs in this area are called the Hawkes and Notre Dame TMF, piled up at the mouths of their respective troughs.
We’re talking BIG features here: The Notre Dame TMF is 200×100 km (pretty much the same size as the southern Nova Scotia mainland where I live), the Hawkes only marginally smaller. That’s just the TMF! Not even counting the canyon
The goal of the research was to improve understanding of the timing and exact processes of deglaciation. There is a good chance that these TMFs contain answers to that question, because so much sediment was deposited so rapidly. In general, the biggest problem in piecing together the history of the earth (which is what geoscientists do), is that there are more gaps than evidence. The famous British geoscientist Derek Ager once compared the global geologic record to a fishing net: “lots of holes tied together with string”. What he meant by that analogy was this: if you were an alien from another planet and you found some string, would you be able to figure out the function of the fishing net? Probably not. Geoscientists often feel like these proverbial aliens: all we get is a bit of string.
Even though these TMFs likely hold the clues for what happened during this time interval, it’s very hard to get at the evidence. The water depth ranges from hundreds to thousands of meters and the weather is generally not cooperative, so you need a sturdy ship. For this study, a few hundred kilometers of seismic data and 6 cores were collected during a 2010 summer cruise with CCGS “Hudson”.
Describing these cores visually (they are split lengthwise) requires an experienced, trained eye. Over the years, protocols have been developed for logging cores. In addition to visual descriptions, the cores are examined with x-ray radiography (just like your chest x-ray). Also, microscopic organisms with calciferous skeletons are sampled for radiocarbon dating, enabling the determination of absolute ages of the sedimentary layers.
The study area of this paper lies to the NW of the Orphan Basin, which was the subject of research in earlier years. I was lucky enough to be able to take my Dalhousie and Acadia University undergraduate earth science students for a lab to the Bedford Institute of Oceanography (BIO) in Dartmouth for several years. As you know (but not all readers of this blog may know), BIO is the home of the Geological Survey of Canada / Atlantic and the home base of the CCGS Hudson. My students were given the opportunity to examine the cores from the Orphan Basin (see reference below). The first look on their face upon seeing the seemingly homogeneous mass of sediment was always one of complete bewilderment. There was nothing to see! It was just mud! Then they got into it, but that’s another story.
So, an area the size of the southern Nova Scotia mainland, and all you have is 6 pin pricks (cores) and some seismic data. It’s testimony to the intelligence and tenacity of researchers over the years that any conclusions can be drawn at all from so little information.
Of course piecing such analyses together doesn’t just take a small ship board party, one summer and a few months of writing up. The authors (who are from universities in Quebec and from the Geological Survey of Canada) refer to several dozen other articles that substantiate and supplement their analyses. The papers they refer to date back to the 1970s, and this means that this is pretty new research. Before that time, we simply didn’t have the technology to do studies like this.
Indeed, 40+ years of painstaking work by dozens and dozens of people and it’s still pretty new research. That’s how science works.
Reference
Tripsanas, E K; Piper, D J W; Jarrett, K A, 2007, Logs of piston cores and interpreted ultra-high-resolution seismic profiles, Orphan Basin. Geological Survey of Canada, Open File 5299, 339 pages; 1 DVD, doi:10.4095/223224. Full report link here
CCGS Hudson
The CCCGS Hudson is Canada’s oldest and most famous research vessel, built in 1960 on the occasion of the opening of the Bedford Institute of Oceanography. The Canadian ship building procurement (announced in October of 2011) includes for the Hudson to be replaced. The original announcement was for the replacement ship to be completed in 2014. This has now been postponed to 2016.


Pingback: Canadian Earth Science for @PMHarper – 2: The Canadian contribution to the International Polar Year | EARTH SCIENCE SOCIETY